Category:Diagrams about the COVID-19 pandemic in Russia (2020-05-03)
Jump to navigation
Jump to search
Media in category "Diagrams about the COVID-19 pandemic in Russia (2020-05-03)"
The following 21 files are in this category, out of 21 total.
-
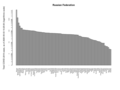
 COVID.2019.barplot.regions (2020-05-03).png 1,000 × 750; 19 KB
-
 COVID.2019.barplot.regions.log.10 (2020-05-03).png 1,000 × 750; 23 KB
-
 COVID.2019.barplot.regions.per 100K (2020-05-03).png 1,000 × 750; 20 KB
-
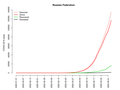
 COVID.2019.cumulated (2020-05-03).png 1,000 × 750; 37 KB
-
 COVID.2019.cumulated.by regions (2020-05-03).png 1,000 × 750; 42 KB
-
 COVID.2019.cumulated.log.10.by regions (2020-05-03).png 1,000 × 750; 51 KB
-
 COVID.2019.cumulated.log10 (2020-05-03).png 1,000 × 750; 39 KB
-
 COVID.2019.cumulated.log10.1M (2020-05-03).png 1,000 × 750; 109 KB
-
 COVID.2019.cumulated.TARD (2020-05-03).png 1,000 × 750; 42 KB
-
 COVID.2019.cumulated.TARD.log10 (2020-05-03).png 1,000 × 750; 56 KB
-
 COVID.2019.fitting.rmc.partial.log10 (2020-05-03).png 1,000 × 750; 228 KB
-
 COVID.2019.fitting.rmc.partial.Mos.log10 (2020-05-03).png 1,000 × 750; 249 KB
-
 COVID.2019.growth ratio (2020-05-03).png 1,000 × 750; 104 KB
-
 COVID.2019.hist.dt (2020-05-03).png 1,000 × 750; 33 KB
-
 COVID.2019.hist.rt (2020-05-03).png 1,000 × 750; 36 KB
-
 COVID.2019.map.density.regions (2020-05-03).png 1,000 × 750; 121 KB
-
 COVID.2019.map.density.regions.per 100K (2020-05-03).png 1,000 × 750; 121 KB
-
 COVID.2019.map.density.regions.rt7dt (2020-05-03).png 1,000 × 750; 135 KB
-
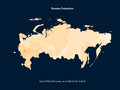
 COVID.2019.map.regions (2020-05-03).png 1,000 × 750; 109 KB
-
 COVID.2019.map.regions.per 100K (2020-05-03).png 1,000 × 750; 111 KB
-
 COVID.2019.mortality.dyn (2020-05-03).png 1,000 × 750; 80 KB
.png)
.png)
.png)
.png)
.png)
.png)
.png)
.png)
.png)
.png)
.png)
.png)
.png)
.png)
.png)
.png)
.png)
.png)
.png)
.png)
.png)