Category:Diagrams about the COVID-19 pandemic in China by province
Jump to navigation
Jump to search
Subcategories
This category has only the following subcategory.
Media in category "Diagrams about the COVID-19 pandemic in China by province"
The following 77 files are in this category, out of 77 total.
-
 COVID-19 daily new cases in Fujian.svg 600 × 371; 84 KB
-
 COVID-19 daily new cases in Gansu.svg 600 × 371; 81 KB
-
 COVID-19 daily new cases in Guizhou.svg 600 × 371; 78 KB
-
 COVID-19 daily new cases in Inner Mongolia.svg 600 × 371; 82 KB
-
 COVID-19 daily new cases in Liaoning.svg 600 × 371; 77 KB
-
 COVID-19 daily new cases in Ningxia.svg 600 × 371; 82 KB
-
 COVID-19 daily new cases in Qinghai.svg 600 × 371; 44 KB
-
 COVID-19 daily new cases in Xinjiang.svg 600 × 371; 78 KB
-
 WHO Covid 2020 Jan-Aug daily C Anhui.pdf 3,300 × 1,950; 18 KB
-
 WHO Covid 2020 Jan-Aug daily C Beijing.pdf 3,300 × 1,950; 18 KB
-
 WHO Covid 2020 Jan-Aug daily C Chongqing.pdf 3,300 × 1,950; 18 KB
-
 WHO Covid 2020 Jan-Aug daily C Fujian.pdf 3,300 × 1,950; 17 KB
-
 WHO Covid 2020 Jan-Aug daily C Gansu.pdf 3,300 × 1,950; 17 KB
-
 WHO Covid 2020 Jan-Aug daily C Guangdong.pdf 3,300 × 1,950; 18 KB
-
 WHO Covid 2020 Jan-Aug daily C Guangxi.pdf 3,300 × 1,950; 16 KB
-
 WHO Covid 2020 Jan-Aug daily C Guizhou.pdf 3,300 × 1,950; 17 KB
-
 WHO Covid 2020 Jan-Aug daily C Hainan.pdf 3,300 × 1,950; 17 KB
-
 WHO Covid 2020 Jan-Aug daily C Hebei.pdf 3,300 × 1,950; 17 KB
-
 WHO Covid 2020 Jan-Aug daily C Heilongjiang.pdf 3,300 × 1,950; 18 KB
-
 WHO Covid 2020 Jan-Aug daily C Henan.pdf 3,300 × 1,950; 17 KB
-
 WHO Covid 2020 Jan-Aug daily C Hubei.pdf 3,300 × 1,950; 19 KB
-
 WHO Covid 2020 Jan-Aug daily C Hunan.pdf 3,300 × 1,950; 17 KB
-
 WHO Covid 2020 Jan-Aug daily C Inner Mongolia.pdf 3,300 × 1,950; 16 KB
-
 WHO Covid 2020 Jan-Aug daily C Jiangsu.pdf 3,300 × 1,950; 17 KB
-
 WHO Covid 2020 Jan-Aug daily C Jiangxi.pdf 3,300 × 1,950; 18 KB
-
 WHO Covid 2020 Jan-Aug daily C Jilin.pdf 3,300 × 1,950; 16 KB
-
 WHO Covid 2020 Jan-Aug daily C Liaoning.pdf 3,300 × 1,950; 16 KB
-
 WHO Covid 2020 Jan-Aug daily C Macao.pdf 3,300 × 1,950; 15 KB
-
 WHO Covid 2020 Jan-Aug daily C Ningxia.pdf 3,300 × 1,950; 16 KB
-
 WHO Covid 2020 Jan-Aug daily C Qinghai.pdf 3,300 × 1,950; 16 KB
-
 WHO Covid 2020 Jan-Aug daily C Shaanxi.pdf 3,300 × 1,950; 18 KB
-
 WHO Covid 2020 Jan-Aug daily C Shandong.pdf 3,300 × 1,950; 18 KB
-
 WHO Covid 2020 Jan-Aug daily C Shanghai.pdf 3,300 × 1,950; 18 KB
-
 WHO Covid 2020 Jan-Aug daily C Shanxi.pdf 3,300 × 1,950; 17 KB
-
 WHO Covid 2020 Jan-Aug daily C Sichuan.pdf 3,300 × 1,950; 18 KB
-
 WHO Covid 2020 Jan-Aug daily C Tianjin.pdf 3,300 × 1,950; 17 KB
-
 WHO Covid 2020 Jan-Aug daily C Unspecified.pdf 3,300 × 1,950; 16 KB
-
 WHO Covid 2020 Jan-Aug daily C Xinjiang.pdf 3,300 × 1,950; 17 KB
-
 WHO Covid 2020 Jan-Aug daily C Yunnan.pdf 3,300 × 1,950; 17 KB
-
 WHO Covid 2020 Jan-Aug daily C Zhejiang.pdf 3,300 × 1,950; 18 KB
-
 WHO Covid C Anhui.pdf 3,300 × 1,950; 16 KB
-
 WHO Covid C Beijing.pdf 3,300 × 1,950; 16 KB
-
 WHO Covid C Chongqing.pdf 3,300 × 1,950; 16 KB
-
 WHO Covid C Fujian.pdf 3,300 × 1,950; 15 KB
-
 WHO Covid C Gansu.pdf 3,300 × 1,950; 15 KB
-
 WHO Covid C Guangdong.pdf 3,300 × 1,950; 16 KB
-
 WHO Covid C Guangxi.pdf 3,300 × 1,950; 15 KB
-
 WHO Covid C Guizhou.pdf 3,300 × 1,950; 15 KB
-
 WHO Covid C Hainan.pdf 3,300 × 1,950; 15 KB
-
 WHO Covid C Hebei.pdf 3,300 × 1,950; 15 KB
-
 WHO Covid C Heilongjiang.pdf 3,300 × 1,950; 16 KB
-
 WHO Covid C Henan.pdf 3,300 × 1,950; 15 KB
-
 WHO Covid C Hubei.pdf 3,300 × 1,950; 16 KB
-
 WHO Covid C Hunan.pdf 3,300 × 1,950; 15 KB
-
 WHO Covid C Inner Mongolia.pdf 3,300 × 1,950; 15 KB
-
 WHO Covid C Jiangsu.pdf 3,300 × 1,950; 15 KB
-
 WHO Covid C Jiangxi.pdf 3,300 × 1,950; 16 KB
-
 WHO Covid C Jilin.pdf 3,300 × 1,950; 15 KB
-
 WHO Covid C Liaoning.pdf 3,300 × 1,950; 15 KB
-
 WHO Covid C Macao.pdf 3,300 × 1,950; 14 KB
-
 WHO Covid C Ningxia.pdf 3,300 × 1,950; 15 KB
-
 WHO Covid C Qinghai.pdf 3,300 × 1,950; 15 KB
-
 WHO Covid C Shaanxi.pdf 3,300 × 1,950; 16 KB
-
 WHO Covid C Shandong.pdf 3,300 × 1,950; 16 KB
-
 WHO Covid C Shanghai.pdf 3,300 × 1,950; 15 KB
-
 WHO Covid C Shanxi.pdf 3,300 × 1,950; 15 KB
-
 WHO Covid C Sichuan.pdf 3,300 × 1,950; 15 KB
-
 WHO Covid C Taipei.pdf 3,300 × 1,950; 15 KB
-
 WHO Covid C Tianjin.pdf 3,300 × 1,950; 15 KB
-
 WHO Covid C Unspecified.pdf 3,300 × 1,950; 15 KB
-
 WHO Covid C Xinjiang.pdf 3,300 × 1,950; 15 KB
-
 WHO Covid C Yunnan.pdf 3,300 × 1,950; 15 KB
-
 WHO Covid C Zhejiang.pdf 3,300 × 1,950; 16 KB
-
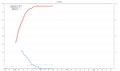
 WHO Covid rn confirmed,deaths closeup China01.pdf 3,475 × 2,045; 21 KB
-
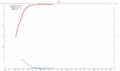
 WHO Covid rn confirmed,deaths closeup China02.pdf 3,475 × 2,045; 21 KB
-
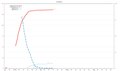
 WHO Covid rn confirmed,deaths closeup China03.pdf 3,475 × 2,045; 21 KB
-
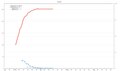
 WHO Covid rn confirmed,deaths closeup China04.pdf 3,475 × 2,045; 20 KB


