Category:Demographic transition
Jump to navigation
Jump to search
English: This category holds models of the demographic transition.
transition from high birth and death rates to lower birth and death rates as a country or region develops from a pre-industrial to an industrialized economic system | |||||
| Upload media | |||||
| Instance of | |||||
|---|---|---|---|---|---|
| Facet of | |||||
| |||||
Subcategories
This category has only the following subcategory.
L
Media in category "Demographic transition"
The following 25 files are in this category, out of 25 total.
-
 Age dependency breakdown by young and old dependents, OWID.svg 850 × 600; 22 KB
-
 Age dependency ratio projected to 2100, OWID.svg 850 × 600; 23 KB
-
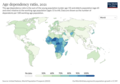 Age Dependency Ratio, 2021.png 1,462 × 1,026; 315 KB
-
 Age dependency ratio, OWID.svg 850 × 600; 154 KB
-
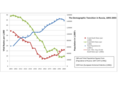
 Demographic change in Sweden 1735-2000.png 652 × 415; 7 KB
-
 Demographic Transition010.jpg 3,008 × 2,343; 2.93 MB
-
 Demographic-Transition-5-countries.png 2,999 × 2,025; 413 KB
-
 Demographic-TransitionOWID.png 2,364 × 1,875; 258 KB
-
 Demographictransition.jpg 612 × 393; 33 KB
-
 DemogRussia.png 960 × 720; 93 KB
-
 Global aging demographics.webp 1,946 × 894; 96 KB
-
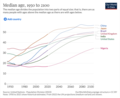 Median Age, 1950-2100.png 1,248 × 1,024; 186 KB
-

-
-

-
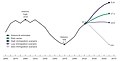
 Percentage of the World Population Over 65 - 1950-2050.png 707 × 500; 23 KB
-
 Projected Hispanic Population in the United States 2020 to 2060.jpg 648 × 483; 62 KB
-
 Projected US Population by Immigration Scenario 2016 to 2060.jpg 1,162 × 1,904; 1.06 MB
-
 Stage5.jpg 359 × 281; 41 KB
-
 Stage5.svg 329 × 281; 25 KB
-
 Stages of DTM (ru).svg 350 × 300; 11 KB
-
 Transition démographique.svg 613 × 330; 16 KB
-
 Transizione demografica schema1.png 2,048 × 1,024; 76 KB
-

-
 U.S. Population 1900–2016, Population Projections 2017–2060 by Immigration Scenario.jpg 1,991 × 1,359; 535 KB


,_stratified_by_age,_sex,_and_ethnicity.jpg)
.jpg)


.svg)
.jpg)
