Category:Demographic charts of Austria
Jump to navigation
Jump to search
Subcategories
This category has the following 3 subcategories, out of 3 total.
L
P
- Population pyramids of Austria (16 F)
Media in category "Demographic charts of Austria"
The following 17 files are in this category, out of 17 total.
-
 Ausländeranteil in Österreich von 1961 bis 2017.jpg 622 × 705; 58 KB
-
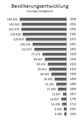
 Bevoelkerungsentwicklung Österreich.png 1,095 × 805; 17 KB
-
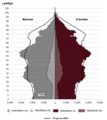 Bevolkingsprognose tirol.png 534 × 601; 76 KB
-
 Bevölkerungsentwicklung Wien.jpg 1,731 × 987; 263 KB
-
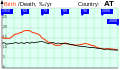 BirthDeath 1950 AT.svg 480 × 280; 8 KB
-
 Captura de Tela 2020-04-20 às 01.45.18.png 849 × 505; 39 KB
-
 Ehescheidungen und Gesamtscheidungsrate seit 1951.gif 612 × 410; 13 KB
-
 Einwohner salzburg.png 352 × 527; 16 KB
-
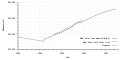 Einwohnerentwicklung von Graz - Prognosen.svg 800 × 400; 48 KB
-
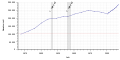 Einwohnerentwicklung von Graz.svg 800 × 400; 57 KB
-
 Einwohnerentwicklung von Statutarstadt Linz.svg 800 × 400; 32 KB
-
 Evoluo de la nombro de enloĝantoj.PNG 463 × 218; 7 KB
-
 Gerasdorf Einwohnerzahl 1869-2017.png 1,673 × 1,052; 93 KB
-
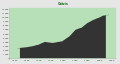 Demography Goetzis.svg 1,240 × 660; 5 KB
-
 Pobl austria 1910 2006.png 1,414 × 2,032; 908 KB
-
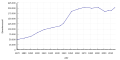
 Population of Vienna.svg 800 × 400; 23 KB
-
 Tirol I.png 536 × 338; 38 KB


