Category:Demographic bar charts
Jump to navigation
Jump to search
Media in category "Demographic bar charts"
The following 83 files are in this category, out of 83 total.
-
 1850-2019 population bienne.png 600 × 500; 8 KB
-
 1881 bar chart paint.jpg 539 × 391; 52 KB
-
 1881 Occupational Census Data.jpg 832 × 542; 72 KB
-
 Abkhazia population changes 1989-2003 chart.svg 512 × 512; 124 KB
-
 Accommodation Type 2011.jpg 493 × 342; 36 KB
-
 Age Demographic table of Magdalen Laver.jpg 478 × 286; 25 KB
-
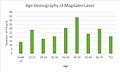 Age demography of Magdalen Laver.jpg 479 × 287; 25 KB
-
 Age Distribution in Cobourg 2006.png 1,048 × 728; 20 KB
-
 Age Distribution of Holland MI.png 911 × 623; 64 KB
-
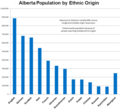 Alberta Population by Ethnic Origin.PNG 594 × 546; 63 KB
-
 Amount of Households in Stainton Between 1881 and 2011.jpg 539 × 391; 37 KB
-
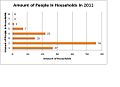 Amount of people in houeholds in 2011.jpg 539 × 391; 35 KB
-
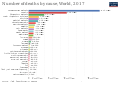
 Annual number of deaths by cause.png 3,400 × 2,400; 596 KB
-
 Annual number of deaths by cause.svg 850 × 600; 34 KB
-
 Autism Prevalence to 2014.png 1,122 × 792; 25 KB
-
 Befolkningsstatistik-skovde.JPG 366 × 330; 27 KB
-
 Bevölkerungsentwicklung 1815 - 2014.jpg 474 × 283; 63 KB
-
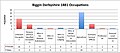 Biggin Derbyshire 1881 Occupations.jpg 577 × 253; 40 KB
-
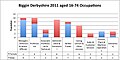 Biggin Derbyshire 2011 Occupations.jpg 516 × 260; 39 KB
-
 Boyton occupation chart 1881.jpg 757 × 593; 61 KB
-
 Chart comparing Koreatown’s ethnic population breakdown overtime.png 1,194 × 718; 66 KB
-
 Crime recorded 2010.jpg 477 × 292; 35 KB
-
 Distance travelled to work 2011.jpg 482 × 290; 26 KB
-
 Duitsland inwonertal 15 grootste steden 2015.svg 510 × 361; 16 KB
-
 Einwohnerentwicklung Wahn.png 1,069 × 804; 24 KB
-
 Exercício 19 da Iniciação à Pesquisa Científica.png 920 × 462; 15 KB
-
 Exercício do ploter teste.jpg 929 × 422; 61 KB
-

-
 Gera Einwohnerentwicklung3.jpg 1,328 × 809; 93 KB
-
 Grafica Yunhe.png 1,618 × 518; 19 KB
-
 Graphic chart of population density in northern Taiwan 1933.jpg 864 × 1,297; 165 KB
-
-
 Gráfica La Puebla de Montalbán.jpg 1,178 × 556; 134 KB
-
 Hajdudorog Inhabitants after Changing the System.jpg 1,435 × 1,080; 338 KB
-
 Hajdudorog Nepessegvaltozas.jpg 1,435 × 1,080; 291 KB
-
 Housing environment.jpg 482 × 287; 31 KB
-
 JapanesePopulationHawaii1890&1920.jpg 559 × 337; 32 KB
-
 Korean and Latinx population changes in Koreatown between 1990-2000.png 1,144 × 722; 158 KB
-
 Marital Status in Willow Bunch.png 915 × 803; 25 KB
-
 Montanchez graf1.png 1,249 × 345; 40 KB
-
 NbImmigAge.jpg 835 × 446; 63 KB
-
 Non-Native Languages of Assam.jpg 1,906 × 3,264; 410 KB
-
 Occupational Structure in 1881.jpg 853 × 426; 55 KB
-
 Occupational structure of Quenington in 1881.png 544 × 349; 11 KB
-
 Occupations for Chattisham 1881.png 1,406 × 1,014; 222 KB
-
 Occupations of Broughton East citizens graph.jpg 534 × 334; 49 KB
-
 Peranakan and Totok Populations.png 808 × 526; 65 KB
-
 Percentage of Population Residing in Urban Areas 1950-2050.png 1,658 × 707; 114 KB
-
 Poblacion Distritos.JPG 556 × 316; 30 KB
-
 Population growth 2006 to 2016.svg 512 × 663; 68 KB
-
 Population growth in more and less developed regions 1950-2100.png 1,669 × 770; 60 KB
-
 Population of Myanmar in Burmese Language.png 576 × 335; 16 KB
-
 Population of Myanmar.png 575 × 338; 22 KB
-
 Population of Nauru by District (2005).png 728 × 435; 15 KB
-
 Population of Norbury according to the 2011 census.jpg 1,000 × 667; 52 KB
-
 População segundo o sexo - Fercal - Distrito Federal- 2015.jpg 985 × 579; 48 KB
-
 População urbana.jpg 982 × 608; 43 KB
-
 PropImmigAge.jpg 835 × 484; 72 KB
-
 Quaification of Stainton members in 2011.jpg 539 × 391; 38 KB
-
 Quaifications In Stainton In 2011.jpg 539 × 391; 36 KB
-
 Qualifications in Haile.jpg 481 × 289; 26 KB
-
 Qualifications in Stainton in 2011.jpg 539 × 391; 35 KB
-
 Race and ethnicity in the United States Census, 2010 - ru.svg 1,100 × 454; 47 KB
-
 Religious distribution among minorities in Indonesia (2000).png 1,100 × 748; 81 KB
-
 Répartion de la population par quartier à Chambéry.png 491 × 289; 58 KB
-
 Seattle's historical population.png 627 × 371; 11 KB
-
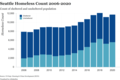 SeattleHomelessnessBarChart.png 3,600 × 2,400; 98 KB
-
 Snyderman-rothman.png 1,055 × 720; 26 KB
-
 Statistik jüdische Einwohnerschaft von Jever 1735 - 1942.jpg 882 × 622; 70 KB
-
 Strasbourg - Variation de la population.png 729 × 442; 20 KB
-
 Todesalter.svg 450 × 275; 33 KB
-
 Todesalter2.svg 450 × 275; 34 KB
-
 Total Fertility Rates for Select Countries-2005-2010.jpg 1,399 × 925; 62 KB
-
 Trento popolazione1.JPG 581 × 341; 25 KB
-

-
 Verstedelijking.png 617 × 541; 16 KB
-
 Village-population.jpg 480 × 210; 32 KB
-
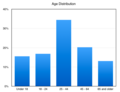 Waltham age distribution.png 531 × 407; 47 KB
-
 Willisham 2011 Occupational Statistics.jpg 574 × 385; 45 KB
-
 Zwoenitz 1990 2012.jpg 2,185 × 1,417; 856 KB
-
 Zwoenitz 1999 2012.jpg 1,063 × 898; 741 KB
-
 製造出荷額等.jpg 663 × 302; 67 KB
-
 見附市世帯数の推移.jpg 700 × 307; 62 KB


.png)


.png)


