Category:Categories per capita
Jump to navigation
Jump to search
English: Categories which show statistics converted to the number of persons which are involved.
Latin phrase; "by heads"/"for each head" | |||||
| Upload media | |||||
| Instance of | |||||
|---|---|---|---|---|---|
| Facet of | |||||
| |||||
Subcategories
This category has the following 14 subcategories, out of 14 total.
Media in category "Categories per capita"
The following 49 files are in this category, out of 49 total.
-
 2019 Gun suicides per capita - by country.svg 1,200 × 675; 3 KB
-

-
 Adolescent birth rate, OWID.svg 850 × 600; 87 KB
-
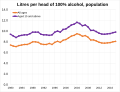 Alcohol consumption rate in the United Kingdom.svg 2,504 × 1,916; 24 KB
-
 Alcohol-consumption-per-person-us.jpg 3,400 × 2,400; 133 KB
-
 Beer consumption per person in the UK.svg 850 × 600; 31 KB
-
 BNPperhoofd2013-2019.png 1,350 × 1,250; 104 KB
-
 Cardiovascular-disease-death-rate-over-time-males-vs-females.png 3,400 × 3,398; 896 KB
-
 Cardiovascular-disease-death-rates.png 3,400 × 2,400; 737 KB
-
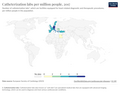 Catheterization-labs-per-million-people.png 3,400 × 2,643; 914 KB
-
-
 Co-emissions-per-capita-map.png 3,400 × 2,700; 913 KB
-
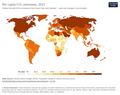
 CO2 emissions per capita, 2016 (Our World in Data).svg 850 × 600; 155 KB
-
 CO2 emissions per capita, 2017 (Our World in Data).svg 850 × 600; 155 KB
-
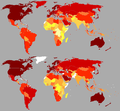
 CO2-emissions-per-capita-map.png 3,400 × 2,706; 1,002 KB
-
 CO2-emissions-per-capita.png 3,400 × 2,706; 767 KB
-
 Co2-per-capita-marimekko (OWID 0184).png 850 × 600; 75 KB
-
 Daily meat consumption per person.svg 850 × 600; 163 KB
-
 Daily-caloric-supply-derived-from-carbohydrates-protein-and-fat.png 3,400 × 2,400; 468 KB
-
 Dalys-from-autistic-spectrum-disorders.png 3,400 × 2,400; 742 KB
-
 Dalys-particulate-matter.png 3,400 × 2,400; 730 KB
-
 Death-rate-from-rheumatic-heart-disease-who-ghe-age-standardized.png 3,400 × 2,857; 1,000 KB
-
 Death-rate-smoking.png 3,082 × 1,836; 487 KB
-
 Deaths-from-smallpox-per-1000-population.png 3,400 × 2,765; 849 KB
-
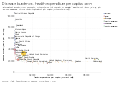 Disease burden vs. health expenditure per capita, OWID.svg 850 × 600; 34 KB
-
 Disease-burden-rates-from-cancers (1).png 3,400 × 2,400; 741 KB
-
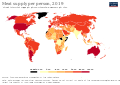
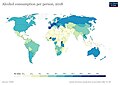
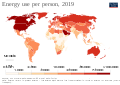 Energy use per person 2019 - OWID.svg 850 × 600; 153 KB
-
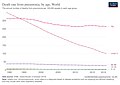
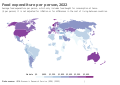 Food expenditure per person per year, OWID.svg 850 × 600; 139 KB
-
 GDP (PPP) per capita, 2012 IMF.jpg 3,600 × 1,640; 534 KB
-
 Hazardous-waste-generated-per-capita.png 3,400 × 2,400; 833 KB
-
 Hiv-death-rates (1).png 3,400 × 2,400; 731 KB
-
 Human welfare and ecological footprint.jpg 850 × 522; 182 KB
-
 Incidence-of-tuberculosis-sdgs.jpg 3,400 × 2,975; 449 KB
-
 Incidence-of-tuberculosis-sdgs.png 3,400 × 2,905; 985 KB
-
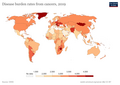
 Infectious-and-parasitic-diseases-death-rate-who-mdb.jpg 3,400 × 3,718; 833 KB
-
 Intensive-care-beds-per-100000.png 3,400 × 2,400; 781 KB
-
 Mapa dos estados brasileiros por renda per capita (2023).png 752 × 726; 52 KB
-
 Meat Supply per Person.svg 850 × 600; 164 KB
-
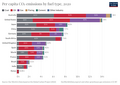 Per-capita-co2-by-fuel (OWID 0792).png 850 × 600; 62 KB
-
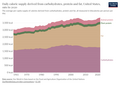
 Per-capita-co2-region (OWID 0782).png 850 × 600; 54 KB
-
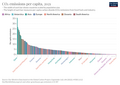
 Per-capita-ghg-emissions.png 3,400 × 2,400; 849 KB
-
 Pneumonia-death-rates-age-standardized.png 3,400 × 2,700; 922 KB
-
 Pneumonia-mortality-by-age.jpg 2,656 × 1,875; 370 KB
-
 Prevalencecysticercosis.png 2,656 × 1,875; 620 KB
-
 Sales-of-cigarettes-per-adult-per-day (1).svg 4,250 × 3,000; 151 KB
-
 Scientific-publications-per-million.png 3,400 × 2,400; 826 KB
-
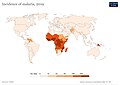 The-incidence-of-malaria-per-1000-population.jpg 3,400 × 2,400; 263 KB
-
 Total-alcohol-consumption-per-capita-litres-of-pure-alcohol.jpg 3,400 × 2,400; 249 KB
-
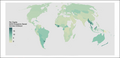
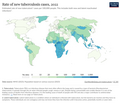
 Tuberculosis incidence (per 100,000 people), OWID.svg 850 × 600; 140 KB

_emissions_per_person_versus_GDP_per_person_-_scatter_plot.svg)


.svg)
.svg)


.png)


.png)


_per_capita,_2012_IMF.jpg)

.png)


.png)

.png)
.png)


.svg)


,_OWID.svg)