Category:Carroll diagrams
Jump to navigation
Jump to search
diagram type | |||||
| Upload media | |||||
| Subclass of | |||||
|---|---|---|---|---|---|
| Named after | |||||
| |||||
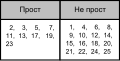
A Carroll diagram is a logic diagram used for grouping things in a yes/no fashion/theory . Numbers or objects are either categorised as 'x' (having an attribute x) or 'not x' (not having that attribute).
Media in category "Carroll diagrams"
The following 21 files are in this category, out of 21 total.
-
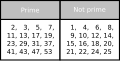 Carroll Diagram (simple).svg 222 × 112; 71 KB
-
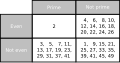 Carroll Diagram (two criteria).svg 302 × 157; 97 KB
-
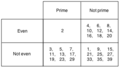 Carroll diagram 2.png 331 × 188; 6 KB
-
 Carroll diagram.png 271 × 118; 5 KB
-
 Carroll diagram.svg 402 × 173; 5 KB
-
 Carroll-barbara.png 900 × 250; 10 KB
-
 Carroll1-4.png 800 × 150; 20 KB
-
 Carroll2-3.png 720 × 220; 5 KB
-
 Carroll2a.PNG 240 × 190; 1 KB
-
 Carroll2b.PNG 240 × 190; 1 KB
-
 Carroll2c.PNG 240 × 190; 1 KB
-
 CarrollPandS.svg 300 × 300; 5 KB
-
 CarrollPinS.svg 300 × 300; 5 KB
-
 CarrollSinNP.svg 300 × 300; 5 KB
-
 CarrollSinP.svg 300 × 300; 5 KB
-
 Diagrama de Carroll 01.svg 600 × 500; 27 KB
-
 Diagrama de Carroll 02.svg 600 × 600; 25 KB
-
 Diagrama de Carroll 11.svg 600 × 500; 27 KB
-
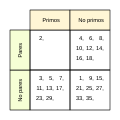 Diagrama de Carroll 12.svg 600 × 600; 25 KB
-
 Kerolov dijagram 2d.svg 302 × 157; 63 KB
-
 Kerolov dijagram ednostaven w.svg 222 × 112; 64 KB
.svg)
.svg)


