Category:CBS statistics (Netherlands)
Jump to navigation
Jump to search
Wikimedia category | |||||
| Upload media | |||||
| Instance of | |||||
|---|---|---|---|---|---|
| Category combines topics | |||||
| Statistics Netherlands | |||||
Netherlands' principal government institution in charge of statistics and census data | |||||
| Instance of |
| ||||
| Part of |
| ||||
| Location |
| ||||
| Headquarters location |
| ||||
| Inception |
| ||||
| Different from | |||||
| official website | |||||
| |||||
Nederlands: Statistische gegevens die afkomstig zijn van het Centraal Bureau voor de Statistiek (CBS) in Nederland. Het kan gaan om data, gebruikte en/of verwerkte data in bijvoorbeeld grafieken of kaarten, of om andere publicaties van het CBS.
Subcategories
This category has the following 14 subcategories, out of 14 total.
L
P
S
Media in category "CBS statistics (Netherlands)"
The following 86 files are in this category, out of 86 total.
-
 Werkloosheid 1921-1939.gif 396 × 236; 3 KB
-
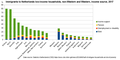 2017 Immigrants to Netherlands low-income households.png 854 × 426; 27 KB
-
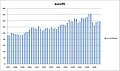
 Aandeel duurzaam.png 1,333 × 1,647; 28 KB
-

-

-

-

-

-

-
-

-

-

-
 Aardgas in Nederland.png 2,174 × 1,537; 800 KB
-
 AgeSexPyramid 2022 Nederland.svg 560 × 400; 5 KB
-
 AgeSexPyramid 2023 Nederland.svg 560 × 400; 5 KB
-
 Alleenstaande Belgen in Nederland.png 527 × 609; 171 KB
-

-
 Alleenstaande Nederlanders in België.png 503 × 422; 153 KB
-
 Belgen in Nederland.png 517 × 625; 165 KB
-
 Beroepsbevolking 1800 2013 21092018 141146.png 1,280 × 956; 126 KB
-
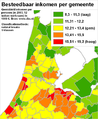
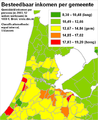 Besteedbaar inkomen equal interval map.png 720 × 878; 61 KB
-
 Besteedbaar inkomen handmatig 100 pct map.png 720 × 878; 65 KB
-
 Besteedbaar inkomen handmatig 100 pct met extra labels map.png 720 × 878; 69 KB
-
 Besteedbaar inkomen handmatig extremen map.png 720 × 878; 61 KB
-
 Besteedbaar inkomen nat breaks map.png 720 × 877; 61 KB
-
 Besteedbaar inkomen quantile 18 klassen map.png 720 × 878; 64 KB
-
 Besteedbaar inkomen quantile 3 klassen map.png 720 × 878; 58 KB
-
 Besteedbaar inkomen quantile 5 klassen andere kleuren.png 720 × 877; 60 KB
-
 Besteedbaar inkomen quantile 7 klassen map.png 720 × 878; 62 KB
-
 Besteedbaar inkomen quantile map.png 720 × 878; 61 KB
-
 Besteedbaar inkomen standaard deviatie map.png 720 × 878; 66 KB
-
 Cbs statistieken spijbelen.jpg 456 × 249; 37 KB
-
 Chinese Surinamers in Nederland.png 641 × 787; 203 KB
-
 Creolen in Nederland.png 651 × 791; 207 KB
-
 Def ranglijst hoge inkomens.png 377 × 470; 11 KB
-
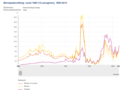
 Demografische ontwikkeling PL.png 358 × 247; 5 KB
-
 Density Netherlands 2007.png 2,333 × 2,644; 843 KB
-
 Dienstboden.jpg 960 × 720; 43 KB
-
 Dubbele nationaliteit Nederland 2008.jpg 500 × 257; 21 KB
-
 Dutch house prices CBS LibreOffice.png 714 × 452; 330 KB
-
 Dutch house prices CBS.png 970 × 604; 17 KB
-
 EUD 2018-71.pdf 1,239 × 1,752, 13 pages; 371 KB
-
 Euro95-2009-cbs.jpg 812 × 478; 145 KB
-
 Gezinsvorming.gif 356 × 304; 5 KB
-
 Grafiek Adopties Nederland 1995-2005.jpg 905 × 525; 68 KB
-
 Handboek Geo-visualisatie DeelB 20 7 2008.pdf 1,239 × 1,754, 106 pages; 13.62 MB
-
 Herkomst dubbele nationaliteit Nederland.jpg 499 × 329; 21 KB
-
 Hindoestanen in Nederland.png 649 × 775; 206 KB
-
 Immigratiemotieven 2003.gif 355 × 328; 4 KB
-
 Inflatie Nederland.png 700 × 350; 11 KB
-
Is het terecht dat vrouwen minder verdienen dan mannen.webm 3 min 39 s, 1,920 × 1,080; 39.36 MB
-
 Islam in Netherlands.jpg 1,027 × 1,195; 264 KB
-
 Islamieten in Nederland cirkel.jpg 499 × 359; 16 KB
-
 Javanen in Nederland.png 641 × 791; 204 KB
-
 LocationDelftseHout.png 422 × 527; 28 KB
-
 Marrons in Nederland.png 651 × 797; 206 KB
-
 Modalsplit Goederen.PNG 406 × 328; 5 KB
-
 Nederlanders in België.png 509 × 420; 153 KB
-
 NederlandseWerkloosheid.jpg 892 × 427; 38 KB
-
 Noord holland islamieten.png 1,394 × 1,386; 98 KB
-
 Noord-Brabant bevolkingsdichtheid (BAG).png 4,899 × 2,801; 441 KB
-
 Onderwijsniveau bevolking van 15-74 jaar, 2015.png 996 × 555; 62 KB
-

-

-

-
 Percentage Ant Arub Netherlands 2007.png 853 × 973; 87 KB
-
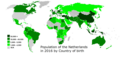 Population of the Netherlands by Country of Birth.png 1,400 × 668; 48 KB
-
 Prognose bevolkingsontwikkeling per ga.png 456 × 449; 9 KB
-
 Ranglijst hoge inkomens.png 377 × 446; 11 KB
-
 Staatsschuld pct bbp recent.png 675 × 380; 11 KB
-
 Staatsschuld pct bbp.PNG 977 × 638; 30 KB
-
 Stedelijk-milieu.jpg 1,023 × 389; 73 KB
-
 Stervensleeftijd 2023.png 550 × 507; 17 KB
-
 Stervensleeftijd.gif 631 × 531; 15 KB
-
 Stijging van de Nederlandse staatsschuld tov 1963.png 535 × 338; 9 KB
-
 Surinamers in Nederland.png 647 × 785; 203 KB
-
 Uitkeringen per 1000 huishoudens.png 483 × 307; 8 KB
-
 Uitkeringen per 1000.png 529 × 413; 13 KB
-
 Verstedelijking.png 617 × 541; 16 KB
-
 Vervoermiddelgebruik in Nederland (2016).png 752 × 452; 104 KB
-
 Vervoermiddelgebruik.png 479 × 307; 35 KB
-
 Visualisatie staafdiagram enkel met labels.PNG 681 × 554; 21 KB
-
 Visualisatie taartpunten ongenormaliseerd beide.PNG 726 × 555; 22 KB
-
 Werkloosheidspercentage naar geslacht vanaf 1990.png 1,280 × 1,501; 90 KB
-
 Winning Steenkool in Nederland.png 1,800 × 1,200; 18 KB


.png)


.png)


