Category:Bubble charts
Jump to navigation
Jump to search
chart  | |||||
| Upload media | |||||
| Subclass of | |||||
|---|---|---|---|---|---|
| |||||
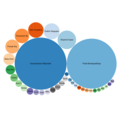
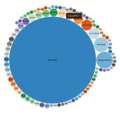
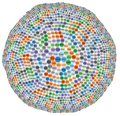
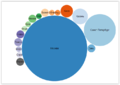
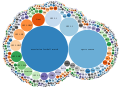
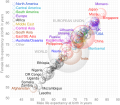
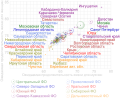
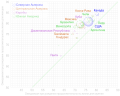
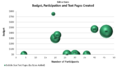
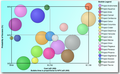
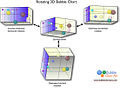
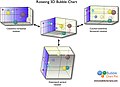
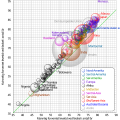
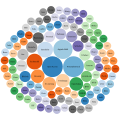
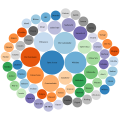
English: A bubble chart is a type of chart that displays three dimensions of data.
Italiano: Un bubble chart è un grafico bidimensionale, rappresentante le relazioni tra tre variabili. Una delle tre variabili è rappresentata con cerchi di dimensione proporzionale al valore.
Media in category "Bubble charts"
The following 152 files are in this category, out of 152 total.
-
 100 most translated concepts using lexemes in Wikidata.svg 580 × 580; 25 KB
-

-

-
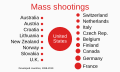 1998- Mass shootings in developed countries - bubble chart.svg 1,000 × 600; 5 KB
-
 2006Australian exports.PNG 1,425 × 625; 60 KB
-
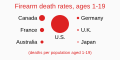 2019-2020 Firearm deaths per population ages 1-19 - bubble chart.svg 1,000 × 500; 1 KB
-
 3D Bubble Chart Example.png 2,107 × 1,937; 1.16 MB
-
 3Variable BubbleChart.svg 320 × 320; 12 KB
-
 400-Relative dioxin levels.svg 512 × 1,151; 6 KB
-
 Abzockerei.png 1,500 × 1,350; 141 KB
-
 Adobe Flex BubbleChart.png 320 × 320; 9 KB
-
 All origin countries of type of sports.png 897 × 770; 149 KB
-
 Antal artiklar.jpg 905 × 667; 102 KB
-
 Ashby plot big.jpg 750 × 577; 112 KB
-

-
 BCG Matrix with cashflows-small.png 459 × 337; 109 KB
-
 BCG Matrix with products-small.png 459 × 325; 77 KB
-
 BCG-Matrix2.svg 640 × 350; 18 KB
-
 Bitcoin-bubble-chart-history-2017.png 1,160 × 529; 111 KB
-
 Bubble chart area.svg 262 × 113; 5 KB
-
 Bubble Chart Chicago Deposit Market.jpg 696 × 555; 87 KB
-
 Bubble chart diameter.svg 262 × 113; 5 KB
-

-

-
 Bubble chart forms of government countries according to Wikidata 2020.png 1,019 × 901; 134 KB
-

-
 Bubble chart forms of government countries according to Wikidata.png 576 × 508; 60 KB
-

-

-

-

-

-
 Bubble Chart of Crime versus Poverty in 50 states.jpg 750 × 480; 52 KB
-
 Bubble chart of programming paradigm.svg 950 × 950; 24 KB
-
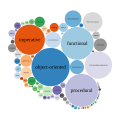 Bubble chart of programming paradigms en.svg 950 × 950; 21 KB
-

-

-
-
 Bubble chart showing musical works by genres (after WD10 datathon).png 938 × 820; 377 KB
-

-

-

-
-

-
-

-
-

-
-

-

-

-

-

-

-
-
 Bubble chart TED speakers occupations.png 764 × 699; 158 KB
-

-
 Bubble chart.jpg 583 × 431; 76 KB
-
 Bubble Chart.svg 512 × 422; 30 KB
-
 Bubble graph of graduates of theological schools.png 1,062 × 725; 121 KB
-
 BubbleChart. City + University..png 695 × 491; 34 KB
-
 Classes using P1923, bubble chart.svg 873 × 643; 172 KB
-
 Comparison gender life expectancy CIA factbook.svg 512 × 448; 127 KB
-
 Comparison of life expectancy in Russian subjects by sex -ru.svg 512 × 426; 69 KB
-
 Comparison of life expectancy in Russian subjects by sex.svg 512 × 446; 56 KB
-

-

-
 Comparison of male and female life expectancy -Africa -ru.svg 512 × 407; 36 KB
-
 Comparison of male and female life expectancy -Africa.svg 512 × 407; 33 KB
-
 Comparison of male and female life expectancy -America -ru.svg 512 × 407; 24 KB
-
 Comparison of male and female life expectancy -America.svg 512 × 407; 23 KB
-
 Comparison of male and female life expectancy -Asia -ru.svg 512 × 407; 39 KB
-
 Comparison of male and female life expectancy -Asia.svg 512 × 407; 36 KB
-
 Comparison of male and female life expectancy -Europe -ru.svg 512 × 407; 31 KB
-
 Comparison of male and female life expectancy -Europe.svg 512 × 407; 29 KB
-
 Comparison of male and female life expectancy -world -ru.svg 512 × 407; 92 KB
-
 Comparison of male and female life expectancy -world.svg 512 × 407; 85 KB
-
D3.js-tutorial-16-Cluster,-Pack-&-Bubble-layouts.webm 13 min 42 s, 1,280 × 720; 26.9 MB
-
 Elections fédérales 2011 Parlement.jpeg 892 × 662; 410 KB
-
 File extensions quantity of source code 2017.PNG 994 × 928; 189 KB
-
 File extensions quantity of source code 2020.PNG 954 × 906; 161 KB
-
 File extensions quantity of source code 2020.svg 950 × 950; 25 KB
-
 File extensions quantity of source code.svg 654 × 654; 20 KB
-
 Folio Plot BCG Matrix Example.png 2,816 × 2,840; 75 KB
-

-
 GLAM Bubble 1.png 751 × 528; 76 KB
-
 GLAM Bubble 1ALT.png 751 × 528; 95 KB
-
 Hans Rosling 2-fd0000 (9504183446).jpg 1,024 × 1,024; 284 KB
-
 Israeli publishers interests.svg 918 × 918; 98 KB
-
 Ita universities.png 918 × 488; 19 KB
-
 Languages cp-02.svg 512 × 512; 35 KB
-
 List of countries by firearm-related death rate.jpg 942 × 879; 133 KB
-
 List of metropolitan areas by population.jpg 1,695 × 925; 116 KB
-
 List of wars by death toll.jpg 1,455 × 869; 85 KB
-
 MatriceBoston.PNG 549 × 317; 53 KB
-
 Most common languages of periodicals on Wikidata.png 1,146 × 748; 99 KB
-
 Most used properties on library - bubble chart from Wikidata WikiProject Libraries.svg 1,243 × 1,243; 315 KB
-
 Net Present Value vs Payback Period.jpg 1,088 × 610; 66 KB
-
 Net Present Value vs Risk in Project Portfolio Management Example.jpg 1,433 × 982; 103 KB
-
 NPOESS EDR-to-Sensor Mapping Bubble Chart.jpg 740 × 557; 109 KB
-
 Number of out of school children by country - bubble chart.png 888 × 688; 81 KB
-
 Occupations of Icelandic Women on Wikidata.png 963 × 788; 127 KB
-
 OpenfMRI journal statistics, 2016-09-19.png 1,165 × 959; 103 KB
-
 Other Photo contests 2 bubble graph Participants to Photos.png 978 × 613; 80 KB
-
 OWC 3 Dollar Per page Participants Pages created.png 976 × 527; 100 KB
-
 OWC 4 Good articles by participation Bubble.png 975 × 526; 77 KB
-
 OWC 5 Featured articles by participation Bubble.png 1,019 × 616; 109 KB
-
 OWC 6 Good articles and Program Duration Bubble.png 976 × 526; 78 KB
-
 OWC 7 Featured articles and Program Duration Bubble.png 976 × 526; 91 KB
-
 PanamaPapers Grafik.svg 463 × 413; 203 KB
-
 PHO 2015 Graph 4 Budget, Participation and Media Uploaded.png 672 × 404; 40 KB
-
 PITCSA Generations.svg 1,191 × 743; 138 KB
-
 Popular surnames Wikidata query.png 669 × 587; 147 KB
-
 Probabilities7.svg 360 × 270; 215 KB
-
 Program Evaluation edit-a-thon - productivity per hour - bubble graph - 2013.png 1,068 × 523; 186 KB
-
 Program Evaluation Edit-a-thon bubble chart - dollar to participants.png 1,050 × 601; 98 KB
-

-
 Program evaluation workshops - dollars to new accounts - 2013.png 1,124 × 628; 61 KB
-

-
 Project Portfolio Bubble Chart.png 750 × 425; 205 KB
-
 Project portfolio management 2D bubble chart.png 550 × 339; 165 KB
-
 Project Portfolio Management Bubble Chart.jpg 550 × 339; 25 KB
-
 Public Debt and Debt to GDP- 2010.png 960 × 720; 27 KB
-
 Reddit-wikipedia survey personality vs intelligence.png 438 × 389; 23 KB
-
 Relative dioxin levels.svg 512 × 807; 4 KB
-
 Rotating 3d bubble chart.jpg 550 × 405; 35 KB
-
 Rotating 3D bubble chart.jpg 550 × 405; 35 KB
-
 Rotating a 3D bubble chart.jpg 550 × 400; 34 KB
-
-
 Schermafbeelding 2016-06-07 om 22.07.33.png 590 × 541; 66 KB
-
 Scholia Screenshot 2017-04-12.png 1,095 × 836; 106 KB
-
 South-sea-bubble-chart (ja).png 250 × 302; 7 KB
-
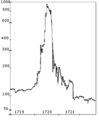 South-sea-bubble-chart.png 250 × 302; 6 KB
-
 SPARQL avlidna musiker i Wikidata.png 750 × 450; 77 KB
-
 T284407.svg 149 × 149; 624 bytes
-
 Tampereen teollisuuslaitosten osakepääoma 1923.svg 750 × 800; 31 KB
-

-
 VBIB20 Baumscheibendiagramm Topics.svg 730 × 730; 31 KB
-
 VBIB21 Baumscheibendiagramm Topics.svg 730 × 730; 17 KB
-
 VBIB22 Baumscheibendiagramm Topics.svg 730 × 730; 17 KB
-
 VBIB23 Baumscheibendiagramm Topics.svg 730 × 730; 13 KB
-
 WDQS - Bubble Chart Result View.png 777 × 728; 180 KB
-
 Wikidata - A Gentle Introduction for Complete Beginners (WikiConference Ukraine 2016).pdf 1,500 × 843, 27 pages; 100 KB
-
 Wikidata - A Gentle Introduction for Complete Beginners.pdf 1,500 × 843, 25 pages; 90 KB
-
 Wikidata - COVID-19 famous deceased people.png 1,398 × 1,846; 1.82 MB
-
 Wikidata COVID-19 bankruptcies.png 5,379 × 5,589; 3.92 MB
-
 Wikidata COVID-19 publications.png 4,337 × 8,590; 16.86 MB
-

-
 Wikidata Query Service - Bubble chart of organizations by number of clinical trials.png 2,493 × 1,852; 355 KB
-
 Wikidata Query Service Output (Bubble Chart).png 943 × 881; 140 KB
-
 Wikipédia-Pays par liens.2011.07.svg 2,908 × 2,118; 114 KB


.svg)
.svg)
.svg)
.svg)


.png)
.png)
.png)
.png)
.png)
.png)
.png)
.png)
.png)
.png)
.png)
.png)
.png)
.png)


.png)


.jpg)


.png)


.png)
