You don't need technical skills in order to contribute here. Be bold when contributing and assume good faith when interacting with others. This is a wiki.
There seems to be a problem regarding the description and/or licensing of this particular file. It has been found that you've added in the image's description only a Template that's not a license and although it provides useful information about the image, it's not a valid license. Could you please resolve this problem, adding the license in the image linked above? You can edit the description page and change the text. Uploading a new version of the file does not change the description of the file. This page may give you more hints on which license to choose. Thank you.
Pavouk Thanks / done! It wasn't just the new year, all data moved around a tiny bit, they must have recalibrated something. I couldn't update the blue confidence bars as I don't know how. Any idea where the source data for those are? Do you think they're useful or should they be cut? --Efbrazil (talk) 00:52, 8 February 2019 (UTC)[reply]
Translating the global warming graphs and diagrams
Hello Efbrazil. I see you have been improving some of the graphs and diagrams in Global warming. As they are very good I am thinking of using some of them in the Turkish article. The first one is easy to translate as it is svg. But I notice some of the others are png. Would it be a good idea/easy to convert them to svg to make them easier to translate do you think?
Chidgk1 (talk) 15:13, 23 May 2019 (UTC)[reply]
Hi Chidgk1, converting the others to SVG is difficult for me, but I could upload png versions without any text if you want to overlay Turkish text on them. Just let me know which specific images you are interested in. Thanks! --Efbrazil (talk) 18:05, 27 May 2019 (UTC)[reply]
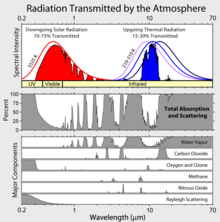
Thanks very much for that offer Efbrazil. As I know very little about graphics I think I had better put in a request at the graphics lab (I have my first request there re something else so am waiting for that to be done or not first) as perhaps translating svg is easier than overlaying png. The ones which are now png and I am thinking might be useful across all languages are below , and also https://www.esrl.noaa.gov/gmd/aggi/aggi.fig2.png. If you know any advantage of keeping them as png, or not putting in the effort to convert them (e.g. overlaying is easier, some other problem with them or better diags or data available), please let me know.Chidgk1 (talk) 08:47, 13 June 2019 (UTC)[reply]
The difficulty with SVG is the graphics would have to be recreated in that format from the ground up, and I don't have the tools or capacity to do that. The technical reason is that the images are all rasterized source, and svg is a vector format (I created some in Powerpoint, others are tweaked from NASA Web sites). Here is how to localize a rasterized image easily, which I recommend you learn if you are interested in localizing images:
Open the highest resolution version of the image into any graphics editor. Even Microsoft Paint will do, or if you want to be fancy you can use a free and more advanced editor like GIMP.
Draw a white box over the text to erase what's there now. Include a black line border if the text has a non-white background
Position a text box in the rectangle and type in the replacement text
I was wondering if you could simplify the first figure of global warming a bit further? (https://en.wikipedia.org/wiki/Global_warming#/media/File:Global_Temperature_Anomaly.svg) We just had a copy-edit done and the reviewer gave some useful feedback on our article's figures. One of their comments was the jargon in the first figure. I was wondering if you could change the following:
In the legend, could you change lowess smoothing (5 year) to 5 year smoothing?
In the title, could you change it to global mean temperature?
Could you change the y-label to temperature difference?
Good feedback. Legend changed to Five-year smoothing. Title changed to Global average temperature (instead of mean) to be even less jargony. Y-label changed to Temperature vs baseline (C) which is maybe more jargony than "Temperature difference" but is also more accurate- the word "difference" doesn't make it clear if this is compared to the previous year, 10 years, etc.--Efbrazil (talk) 18:49, 9 September 2019 (UTC)[reply]
There seems to be a problem regarding the description and/or licensing of this particular file. It has been found that you've added in the image's description only a Template that's not a license and although it provides useful information about the image, it's not a valid license. Could you please resolve this problem, adding the license in the image linked above? You can edit the description page and change the text. Uploading a new version of the file does not change the description of the file. This page may give you more hints on which license to choose. Thank you.
You may have seen the effort to remove climate denial from languages without the capacity to do so themselves. One of the "easy wins" is to add graphs. As you know, your graphs are often among those high-quality graphs we'd like to spread around :). Would you have time to separate a US-specific (to use on enwiki) version of the files? The standard version would only have Celsius, rather than both? Fahrenheit will likely be confusing (or merely clutter), especially in countries where Hollywood isn't a big thing. I'm thinking this would be good for the top two figures of our climate change article (File:Change_in_Average_Temperature.svg, File:Global_Temperature_And_Forces.svg). Thanks! Femkemilene (talk) 18:23, 5 December 2021 (UTC)[reply]
@Femkemilene: Sure, I can do that, good thought! Ideally we'd only show Fahrenheit in America / Liberia / the Cayman islands. I'll try creating new files and using https://en.wikipedia.org/wiki/Template:Engvar to differentiate selection of the files between en-US and the rest of the English speaking world. Does that sound good, or do you know of a better way? --Efbrazil (talk) 21:21, 6 December 2021 (UTC)[reply]
Do you propose to make figures with only Fahrenheit as well? If so, I think that would only work for a very small amount of articles (like regional US warming). Most climate change articles with US engvar are read by people from the rest of the English-speaking / second language speaking world. I was thinking of having a separate file File:Global Temperature Anomaly.svg for Celcius only, and where all the translation data can be stored, and File:Global Temperature Anomaly-Fahrenheit.svg where both Celsius and Fahrenheit are shown. I'm noticing even US-specific newspapers often use Celsius when talking about global warming (but not when talking about local temperatures). Femkemilene (talk) 21:29, 6 December 2021 (UTC)[reply]
I'm not sure what's the right way to go. In an svg it's pretty easy to swap Fahrenheit and Celcius based on whether the audience is en-US or not, and of course I wouldn't have to maintain two versions of a file then, and the images would be simplified. It's also arguably simpler to just present everything in Fahrenheit rather than forcing the audience to make translations all the time. If we are trying to reach a general education US audience then it probably makes sense to speak their language. During article review, did this issue come up as a point of discussion? --Efbrazil (talk) 21:44, 6 December 2021 (UTC)[reply]
@Femkemilene: I created Change in Average Temperature Celcius.svg and it's Celcius-only. I agree that chucking out Celcius for USA audiences is maybe a bit much, seeing as all the climate agreements and IPCC measures are framed in Celcius. I'd like to show the Celcius-only version to English speaking audiences outside the USA, so I'll try to figure out how to do that tomorrow unless you already know how and can direct me. --Efbrazil (talk) 01:21, 7 December 2021 (UTC)[reply]
Brilliant. The reason I asked to make the old file Celsius only, is that it's already used on dozens of other languages. It would be a lot of work to replace all those with the international Celsius version. Femkemilene (talk) 10:35, 7 December 2021 (UTC)[reply]
And unfortunately, my technical knowledge is limited here. Would be fancy, but I don't think it's possible to show different images to people from different countries accessing Wikipedia. Femkemilene (talk) 10:36, 7 December 2021 (UTC)[reply]
@Femkemilene: Well, that got complicated. Upshot is I'll make the change like you initially wanted, but first I need to wait for an admin to rename the new file I created. I can't figure out how to vary the file by region, so the English language version will include Fahrenheit everywhere.
I played with the systemlanguage attribute in SVG files in the hope of using that attribute to have one SVG that would render differently based on region. Unfortunately, the switch statement only works for languages in general, like English vs French. See https://commons.wikimedia.org/wiki/File:SystemLanguage.svg. Once I figured that out I dropped the idea.
I also played with the wikipedia engvar template in the hopes of saying "if en-US then show this image, otherwise show that image", but I couldn't get that going. As best I can tell, the engvar template is just a hack to pass in the region from a region-specific article to an infobox template so it can show information correct to that region. Maybe that's wrong, but I couldn't find examples that were different.
The main file had already been localized, so I had to be careful with the edit to not cause regressions (I couldn't just tweak the source and export a new file). I think the final effect is OK. It renders differently in Catalan because of systemlanguage encoding in the SVG itself. It's not uploaded yet though- I'll make that change once the file naming is corrected. --Efbrazil (talk) 23:26, 7 December 2021 (UTC)[reply]


