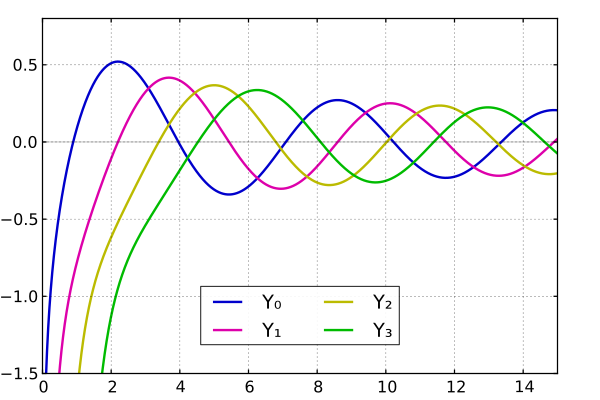
Bessel functions of the second kind plotted using mplwp
mplwp is the matplotlib extension for Wikipedia plots (MatPlotLib for Wikipedia Plots). Matplotlib is one of the greatest free plotting libraries for high quality plots. Mplwp provides functions that help creating plots which are optimized for the usage in Wikipedia.
The python code can be copied into a file called mplwp.py and then used by calling import mplwp.
source code (227 lines)
#!/usr/bin/python3# -*- coding: utf8 -*-"""mplwp, version 1.9The Matplotlib extension for Wikipedia plotsrequires: numpy, scipy, matplotlib, lxmlwritten by Geek3 @ commons.wikimedia.orghttps://commons.wikimedia.org/wiki/User:Geek3/mplwpCopyright (C) 2014 - 2020 Geek3This program is free software; you can redistribute it and/or modifyit under the terms of the GNU General Public License as published bythe Free Software Foundation;either version 3 of the License, or (at your option) any later version.This program is distributed in the hope that it will be useful,but WITHOUT ANY WARRANTY; without even the implied warranty ofMERCHANTABILITY or FITNESS FOR A PARTICULAR PURPOSE.See the GNU General Public License for more details.You should have received a copy of the GNU General Public Licensealong with this program; if not, see http://www.gnu.org/licenses/"""importreimportscipyasscimportnumpyasnpfrommathimport*# we don't use pylab, but numpy and pyplot insteadimportmatplotlib.pyplotaspltimportmatplotlibasmplfrommatplotlib.pathimportPathfrommatplotlibimportscaleasmscalefrommatplotlibimporttransformsasmtransformsfrommatplotlib.tickerimportscale_rangefrommatplotlibimportcyclerimportmatplotlib.styletry:fromlxmlimportetreeexceptImportErroraser:print("ImportError:",er)print("You need to install lxml (http://lxml.de/)")exit(1)commons_website="https://commons.wikimedia.org/wiki/File:"color_cycle=("#0000cc","#dd00aa","#999900","#00bb00","#00bbcc","#af77dd","#f46644","#ebca10","#d0f011","#66f800","#99eeff")defunicode_sub(x):""" converts x into a subscript unicode string """table={'-':unichr(8331),'(':unichr(8333),')':unichr(8334)}foriinrange(9+1):table[str(i)]=unichr(8320+i)return''.join([table[ch]forchinstr(x)])defunicode_super(x):""" converts x into a superscript unicode string """table={'-':unichr(8315),'(':unichr(8317),')':unichr(8318)}table['1']=unichr(185)foriinrange(2,3+1):table[str(i)]=unichr(176+i)foriin[0]+range(4,9+1):table[str(i)]=unichr(8304+i)return''.join([table[ch]forchinstr(x)])defset_bordersize(fig,l,r,t,b):""" sets borders around axes in pixels """w,h=fig.get_size_inches()*fig.dpibounds=[l/w,b/h,1-(l+r)/w,1-(t+b)/h]fig.gca().set_position(bounds)defmove_axes(fig,dx,dy):""" move current axes by the given number of pixels """w,h=fig.get_size_inches()*fig.dpibounds=fig.gca().get_position().get_points()bounds=(bounds[0,0]+dx/w,bounds[0,1]+dy/h,bounds[1,0]-bounds[0,0],bounds[1,1]-bounds[0,1])fig.gca().set_position(bounds)defmark_axeszero(ax,x0=None,y0=None):""" marks the zero-gridlines with denser dash patterns Caution! This only works correctly if the gridlines won't change afterwards. """# update gridline dataax.grid(True)ax.figure.canvas.draw()forlinax.xaxis.get_gridlines():if((x0isnotNoneandnp.isclose(l.get_xdata()[0],x0))or(x0isNoneand((l.get_xdata()[0]==0.0andax.get_xscale()=="linear")or(l.get_xdata()[0]==1e0andax.get_xscale()=="log")))):l.set_dashes([3,1])forlinax.yaxis.get_gridlines():if((y0isnotNoneandnp.isclose(l.get_ydata()[0],y0))or(y0isNoneand((l.get_ydata()[0]==0.0andax.get_yscale()=="linear")or(l.get_ydata()[0]==1e0andax.get_yscale()=="log")))):l.set_dashes([3,1])deffig_standard(mpl):width=600.height=400.dpi=72# global settingsmpl.rcdefaults()mpl.style.use("classic")mpl.rc("figure",dpi=dpi)mpl.rc("figure",figsize=(width/dpi,height/dpi))mpl.rc("axes",prop_cycle=mpl.rcsetup.cycler('color',color_cycle))mpl.rc("axes",grid=True)mpl.rc("axes",linewidth=1.25)mpl.rc("lines",markersize=9.6)mpl.rc("lines",markeredgewidth=1.8)mpl.rc("path",simplify=True)mpl.rc("path",snap=False)mpl.rc("lines",linewidth=2.4)mpl.rc("font",size=16)mpl.rcParams["font.sans-serif"]="DejaVu Sans"mpl.rc("mathtext",default="regular")mpl.rc("xtick.major",width=1.25)mpl.rc("ytick.major",width=1.25)mpl.rc("xtick.major",pad=7)mpl.rc("ytick.major",pad=7)mpl.rc("legend",borderaxespad=1.5)fig=plt.figure()ax=fig.gca()# figure settingsax.xaxis.set_major_locator(plt.MaxNLocator(nbins=11,steps=[1,2,2.5,5],integer=False,symmetric=True,prune=None))ax.yaxis.set_major_locator(plt.MaxNLocator(nbins=10,steps=[1,2,5],integer=False,symmetric=True,prune=None))# axes settings# set image margins so that lines will be exactly on a pixell,r,t,b=(42.5,42.5,18.5,26.5)set_bordersize(fig,l,r,t,b)returnfigdefremove_zeros(group,nsmap):forpathingroup.findall(nsmap+"path"):try:d=path.get("d")# remove trailing zerosd=re.sub(r"(\d+)\.0+(?=$|[^\d])",r"\1",d)# 12.00 -> 12d=re.sub(r"\.0+(?=$|[^\d])",r"0",d)# .000 -> 0d=re.sub(r"((\d+\.\d*[1-9])|(\.\d*[1-9]))0+(?=$|[^\d])",r"\1",d)# 12.20300 -> 12.203# insert spaces around lettersd=re.sub(r"([A-z])(\S)",r"\1 \2",d)path.set("d",d)exceptException:pass# recursive callforgingroup.findall(nsmap+"g")+group.findall(nsmap+"defs"):remove_zeros(g,nsmap)deffile_replace_d(fname,old,new):withopen(fname,"r")asf:text=f.read()text=re.sub(r'd="[^"]*"',lambdax:x.group(0).replace(old,new),text)withopen(fname,"w")asf:f.write(text)defpostprocess(fname):""" postprocess svg file generated by matplotlib to fix some problems """file_replace_d(fname,"\n","#")# hide newlines in paths from parserwithopen(fname,"r")assvgfile:tree=etree.parse(svgfile,etree.XMLParser(remove_blank_text=True))svg=tree.getroot()nsmap="{"+svg.nsmap[None]+"}"# define graphic size in pixels instead of ptforvariablein["width","height"]:svg.set(variable,svg.get(variable).replace("pt","px"))# move all definitions to the frontsvg[:]=sorted(svg,key=lambdael:int(el.tag!=nsmap+"defs"))# add title and file descriptiontitle=etree.Element("title")title.text=fnamedesc=etree.Element("desc")desc.text=commons_website+fnamedesc.text+="\nPlot created with mplwp, the Matplotlib extension for Wikipedia plots."svg[:]=[title]+[desc]+svg[:]# remove unnecessary trailing zerosremove_zeros(svg,nsmap)# write back contentwithopen(fname,"w")assvgfile:svgfile.write(etree.tostring(tree.getroot(),pretty_print=True,encoding="unicode"))file_replace_d(fname,"#","\n")# write replaced newlines back


 Digamma function
 Rieman zeta function on the critical line
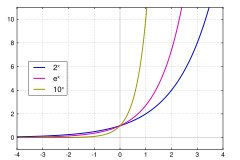 Exponential functions
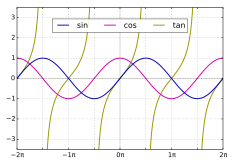 Basic trigonometric functions
 Bessel functions of first kind
 Legendre polynomials
 Resonance curves


