Translations:Help:SVG for math/10/en
Jump to navigation
Jump to search
Probability and Statistics
[edit]
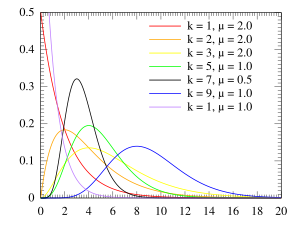
The plot above gives the pdf of Erlang distribution. Since most probability distributions have closed forms in which some special functions (i.e., Gamma function, Beta function) may be used, we favor Gnuplot. Some distributions (i.e., Gamma distribution, F distribution) have diverse shapes for various parameters. Correspondingly one may use the for loop in Gnuplot 4.4+ to draw multiple curves. To prepare a joint bivariate distribution, 3-dimensional representation is appropriate. Then one may use the 3D axes plotting in Gnuplot [1].