File:WHO Covid 2020 Jan-Aug daily C Somalia.pdf
Jump to navigation
Jump to search

Size of this JPG preview of this PDF file: 800 × 473 pixels. Other resolutions: 320 × 189 pixels | 640 × 378 pixels | 1,024 × 605 pixels | 1,280 × 756 pixels | 3,300 × 1,950 pixels.
Original file (3,300 × 1,950 pixels, file size: 21 KB, MIME type: application/pdf)
Captions
Captions
Add a one-line explanation of what this file represents
Summary
[edit]| Description |
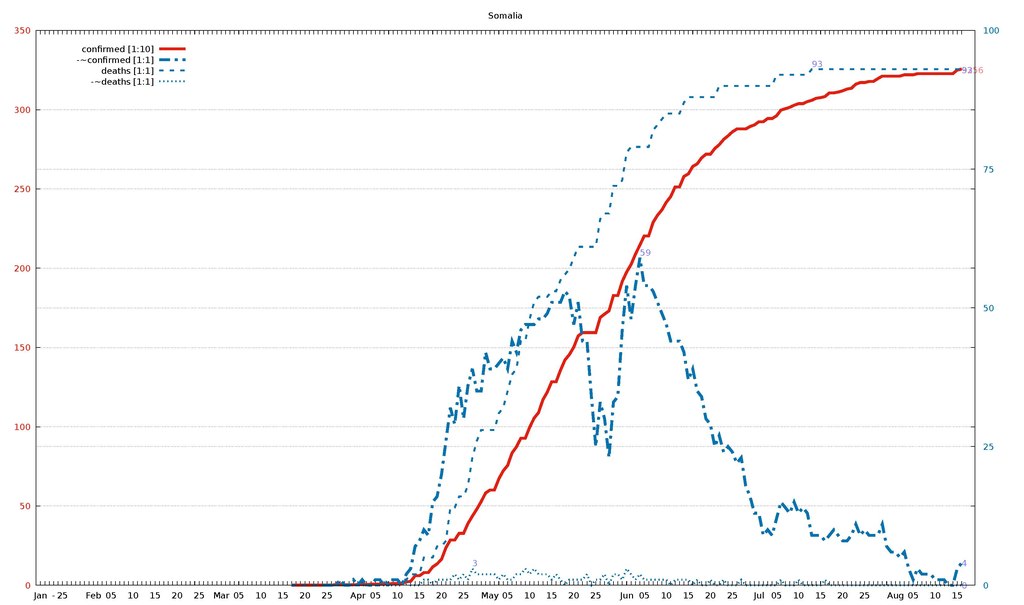
English: Diagram of WHO COVID-19 daily data (20 Jan - 16 Aug 2020) for "Total Confirmed Cases" (thick solid line), its smoothed increment (thick dash-dotted line), "Total Deaths" (thin dashed line) , and its smoothed increment (thin dotted line). Figures are taken from the available situation reports. Red and blue lines refer to the left and right vertical axis, respectively; the scaling factor for each curve is given in the legend. The horizontal axis starts on 20 Jan 2020 (situation report 1), and ends on 16 Aug 2020 (situation report 209). In the smoothed curves, for each day, 1/7 of the difference of the current day's figure and the figure a week ago is shown. For example, in situation report 115 (14 May 2020) and 121 (21 May 2020), there were 8676 and 5339 Total Confirmed Cases in Afghanistan, respectively, so the thick dash-dotted line passes through 477 = (8676-5339)/7 on 21 May.
For an overview of all related visualizations, and a more detailled description, see WHO Covid diagram set#Available country diagrams Jan-Aug 2020 (daily). |
| Date | |
| Source | Own work |
| Author | Jochen Burghardt |
Licensing
[edit]I, the copyright holder of this work, hereby publish it under the following license:
This file is licensed under the Creative Commons Attribution-Share Alike 4.0 International license.
- You are free:
- to share – to copy, distribute and transmit the work
- to remix – to adapt the work
- Under the following conditions:
- attribution – You must give appropriate credit, provide a link to the license, and indicate if changes were made. You may do so in any reasonable manner, but not in any way that suggests the licensor endorses you or your use.
- share alike – If you remix, transform, or build upon the material, you must distribute your contributions under the same or compatible license as the original.
Gnuplot source code
[edit]| Gnuplot source code |
|---|
set term pdf size 22,13
set term pdf font "sans,20"
set output "WHO_Covid_C_Somalia.pdf"
set key autotitle columnhead
set termoption noenhanced
# (1) norm: 326 001 001 001

set xrange [-1:212]
set yrange [0:350]
set y2range [0:100]
set xtics 3650,100
set ytics 50 textcolor "#e51e10"
set y2tics 25 textcolor "#0072b2"
set grid y y2

set title "Somalia"

$data <<EOF
rep day "confirmed [1:10]" "-~confirmed [1:1]" "deaths [1:1]" "-~deaths [1:1]"
1	Jan	.	-	.	-
2	""	.	-	.	-
3	""	.	-	.	-
-	-	-	-	-	-
4	""	.	-	.	-
5	25	.	-	.	-
6	""	.	-	.	-
7	""	.	-	.	-
8	""	.	-	.	-
9	""	.	-	.	-
10	""	.	-	.	-
11	""	.	-	.	-
12	Feb	.	-	.	-
13	""	.	-	.	-
14	""	.	-	.	-
15	""	.	-	.	-
16	05	.	-	.	-
17	""	.	-	.	-
18	""	.	-	.	-
19	""	.	-	.	-
20	""	.	-	.	-
21	10	.	-	.	-
22	""	.	-	.	-
23	""	.	-	.	-
24	""	.	-	.	-
25	""	.	-	.	-
26	15	.	-	.	-
27	""	.	-	.	-
28	""	.	-	.	-
29	""	.	-	.	-
30	""	.	-	.	-
31	20	.	-	.	-
32	""	.	-	.	-
33	""	.	-	.	-
34	""	.	-	.	-
35	""	.	-	.	-
36	25	.	-	.	-
37	""	.	-	.	-
38	""	.	-	.	-
39	""	.	-	.	-
40	""	.	-	.	-
41	Mar	.	-	.	-
42	""	.	-	.	-
43	""	.	-	.	-
44	""	.	-	.	-
45	05	.	-	.	-
46	""	.	-	.	-
47	""	.	-	.	-
48	""	.	-	.	-
49	""	.	-	.	-
50	10	.	-	.	-
51	""	.	-	.	-
52	""	.	-	.	-
53	""	.	-	.	-
54	""	.	-	.	-
55	15	.	-	.	-
56	""	.	-	.	-
57	""	1	-	0	-
58	""	1	-	0	-
59	""	1	-	0	-
60	20	1	-	0	-
61	""	1	-	0	-
62	""	1	-	0	-
63	""	1	-	0	-
64	""	1	0	0	0
65	25	1	0	0	0
66	""	2	0	0	0
67	""	3	0	0	0
68	""	3	1	0	0
69	""	3	0	0	0
70	""	3	0	0	0
71	""	3	1	0	0
72	Apr	5	0	0	0
73	""	5	1	0	0
74	""	5	0	0	0
75	""	7	0	0	0
76	05	7	1	0	0
77	""	7	1	0	0
78	""	7	0	0	0
79	""	8	1	0	0
80	""	12	1	1	0
81	10	12	1	1	0
82	""	12	0	1	0
83	""	21	2	1	1
84	""	25	3	2	0
85	""	60	7	2	0
86	15	60	8	2	0
87	""	80	10	5	1
88	""	80	9	5	1
89	""	116	15	5	0
90	""	135	16	7	1
91	20	164	20	7	1
92	""	237	26	8	1
93	""	286	32	14	1
94	""	286	29	14	2
95	""	328	36	16	1
96	25	328	30	16	2
97	""	390	36	18	1
98	""	436	39	23	3
99	""	480	35	26	2
100	""	528	35	28	2
101	""	582	42	28	2
102	May	601	39	28	2
103	""	601	39	28	2
104	""	671	40	31	1
105	""	722	41	32	2
106	05	756	39	35	1
107	""	835	44	38	1
108	""	873	42	39	2
109	""	928	46	44	2
110	""	928	47	44	3
111	10	997	47	48	2
112	""	1054	47	51	3
113	""	1089	48	52	2
114	""	1170	48	52	2
115	""	1219	49	52	2
116	15	1284	51	53	1
117	""	1284	51	53	2
118	""	1357	51	55	1
119	""	1421	53	56	0
120	""	1455	52	57	1
121	20	1502	47	59	1
122	""	1573	51	61	1
123	""	1594	44	61	1
124	""	1594	44	61	2
125	""	1594	34	61	0
126	25	1594	25	61	1
127	""	1689	33	66	1
128	""	1711	30	67	2
129	""	1731	23	67	0
130	""	1828	33	72	2
131	""	1828	34	72	2
132	""	1916	46	73	1
133	Jun	1976	54	78	3
134	""	2023	48	79	2
135	""	2089	54	79	1
136	""	2146	59	79	2
137	05	2204	54	79	1
138	""	2204	54	79	1
139	""	2289	53	82	1
140	""	2334	51	83	1
141	""	2368	49	84	1
142	10	2416	47	85	1
143	""	2452	44	85	0
144	""	2513	44	85	1
145	""	2513	44	85	1
146	""	2579	42	87	1
147	15	2595	37	88	1
148	""	2642	39	88	0
149	""	2658	35	88	1
150	""	2696	34	88	0
151	""	2719	30	88	0
152	20	2719	29	88	1
153	""	2755	25	88	0
154	""	2779	27	90	0
155	""	2812	24	90	1
156	""	2835	25	90	0
157	25	2860	24	90	0
158	""	2878	22	90	0
159	""	2878	23	90	1
160	""	2878	18	90	0
161	""	2894	16	90	0
162	""	2904	13	90	0
163	Jul	2924	13	90	0
164	""	2924	9	90	0
165	""	2944	10	90	0
166	""	2944	9	90	0
167	05	2961	12	92	0
168	""	2997	15	92	1
169	""	3006	14	92	0
170	""	3015	13	92	0
171	""	3028	15	92	0
172	10	3038	13	92	1
173	""	3038	14	92	0
174	""	3051	13	92	0
175	""	3059	9	93	0
176	""	3072	9	93	0
177	15	3076	9	93	0
178	""	3083	8	93	1
179	""	3106	9	93	0
180	""	3106	10	93	0
181	""	3111	9	93	0
182	20	3119	8	93	0
183	""	3130	8	93	0
184	""	3135	9	93	0
185	""	3161	11	93	0
186	""	3171	9	93	0
187	25	3171	10	93	0
188	""	3178	9	93	0
189	""	3178	9	93	0
190	""	3196	9	93	0
191	""	3212	11	93	0
192	""	3212	7	93	0
193	""	3212	6	93	0
194	Aug	3212	6	93	0
195	""	3212	5	93	0
196	""	3220	6	93	0
197	""	3220	3	93	0
198	05	3220	1	93	0
199	""	3227	3	93	0
200	""	3227	2	93	0
201	""	3227	2	93	0
202	""	3227	2	93	0
203	10	3227	1	93	0
204	""	3227	1	93	0
205	""	3227	1	93	0
206	""	3227	0	93	0
207	""	3227	0	93	0
208	15	3250	3	93	0
209	""	3256	4	93	0
EOF

# confirmed:
set label "3256   " at first 209,325           left back textcolor "#ff8080"
# -~confirmed:
set label "4      " at first 209,  4*350/100   left back textcolor "#8080ff"
set label "59     " at first 136, 59*350/100+4 left back textcolor "#8080ff"
# deaths:
set label "93     " at first 209, 93*350/100   left back textcolor "#8080ff"
set label "93     " at first 175, 93*350/100+4 left back textcolor "#8080ff"
# -~deaths:
set label "0      " at first 209,  0*350/100   left back textcolor "#8080ff"
set label "3      " at first  98,  3*350/100+4 left back textcolor "#8080ff"

set multiplot
  plot $data using 0:($3/     10        ) with lines lc 7 lw 8 dt 1 title at 0.150, 0.920
replot $data using 0:($4/      1*350/100) with lines lc 6 lw 8 dt 4 title at 0.150, 0.902
replot $data using 0:($5/      1*350/100) with lines lc 6 lw 5 dt 2 title at 0.150, 0.884
replot $data using 0:($6/      1*350/100) with lines lc 6 lw 5 dt 3 title at 0.150, 0.866

# plot hor axis calendar
replot $data using 0:(0):xticlabel(2) with lines
|
File history
Click on a date/time to view the file as it appeared at that time.
| Date/Time | Thumbnail | Dimensions | User | Comment | |
|---|---|---|---|---|---|
| current | 19:36, 24 September 2020 |  | 3,300 × 1,950 (21 KB) | Jochen Burghardt (talk | contribs) | =={{int:filedesc}}== {{Information |description={{en|1=Diagram of WHO COVID-19 daily data (20 Jan - 16 Aug 2020) for ''"Total Confirmed Cases"'' (thick solid line), its smoothed increment (thick dash-dotted line), ''"Total Deaths"'' (thin dashed line), and its smoothed increment (thin dotted line); see File:WHO_Covid_2020_Jan-Aug_daily_C_Afghanistan.pdf for details.}} |date=2020-09-24 |source={{own}} |author=Jochen Burghardt |permission= |other_versions=[[:File:... |
You cannot overwrite this file.
File usage on Commons
There are no pages that use this file.