File:WHO Covid 2020 Jan-Aug daily C Sierra Leone.pdf
Jump to navigation
Jump to search

Size of this JPG preview of this PDF file: 800 × 473 pixels. Other resolutions: 320 × 189 pixels | 640 × 378 pixels | 1,024 × 605 pixels | 1,280 × 756 pixels | 3,300 × 1,950 pixels.
Original file (3,300 × 1,950 pixels, file size: 22 KB, MIME type: application/pdf)
Captions
Captions
Add a one-line explanation of what this file represents
Summary
[edit]| Description |
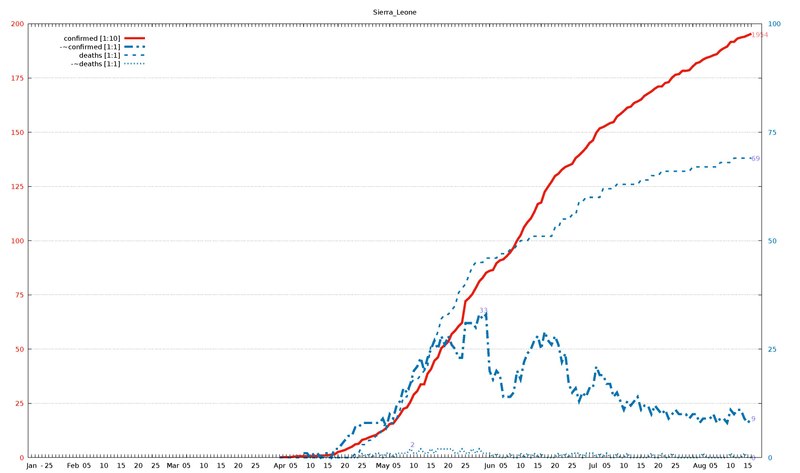
English: Diagram of WHO COVID-19 daily data (20 Jan - 16 Aug 2020) for "Total Confirmed Cases" (thick solid line), its smoothed increment (thick dash-dotted line), "Total Deaths" (thin dashed line) , and its smoothed increment (thin dotted line). Figures are taken from the available situation reports. Red and blue lines refer to the left and right vertical axis, respectively; the scaling factor for each curve is given in the legend. The horizontal axis starts on 20 Jan 2020 (situation report 1), and ends on 16 Aug 2020 (situation report 209). In the smoothed curves, for each day, 1/7 of the difference of the current day's figure and the figure a week ago is shown. For example, in situation report 115 (14 May 2020) and 121 (21 May 2020), there were 8676 and 5339 Total Confirmed Cases in Afghanistan, respectively, so the thick dash-dotted line passes through 477 = (8676-5339)/7 on 21 May.
For an overview of all related visualizations, and a more detailled description, see WHO Covid diagram set#Available country diagrams Jan-Aug 2020 (daily). |
| Date | |
| Source | Own work |
| Author | Jochen Burghardt |
Licensing
[edit]I, the copyright holder of this work, hereby publish it under the following license:
This file is licensed under the Creative Commons Attribution-Share Alike 4.0 International license.
- You are free:
- to share – to copy, distribute and transmit the work
- to remix – to adapt the work
- Under the following conditions:
- attribution – You must give appropriate credit, provide a link to the license, and indicate if changes were made. You may do so in any reasonable manner, but not in any way that suggests the licensor endorses you or your use.
- share alike – If you remix, transform, or build upon the material, you must distribute your contributions under the same or compatible license as the original.
Gnuplot source code
[edit]| Gnuplot source code |
|---|
set term pdf size 22,13
set term pdf font "sans,20"
set output "WHO_Covid_C_Sierra_Leone.pdf"
set key autotitle columnhead
set termoption noenhanced
# (1) norm: 196 001 001 001

set xrange [-1:212]
set yrange [0:200]
set y2range [0:100]
set xtics 3650,100
set ytics 25 textcolor "#e51e10"
set y2tics 25 textcolor "#0072b2"
set grid y y2

set title "Sierra_Leone"

$data <<EOF
rep day "confirmed [1:10]" "-~confirmed [1:1]" "deaths [1:1]" "-~deaths [1:1]"
1	Jan	.	-	.	-
2	""	.	-	.	-
3	""	.	-	.	-
-	-	-	-	-	-
4	""	.	-	.	-
5	25	.	-	.	-
6	""	.	-	.	-
7	""	.	-	.	-
8	""	.	-	.	-
9	""	.	-	.	-
10	""	.	-	.	-
11	""	.	-	.	-
12	Feb	.	-	.	-
13	""	.	-	.	-
14	""	.	-	.	-
15	""	.	-	.	-
16	05	.	-	.	-
17	""	.	-	.	-
18	""	.	-	.	-
19	""	.	-	.	-
20	""	.	-	.	-
21	10	.	-	.	-
22	""	.	-	.	-
23	""	.	-	.	-
24	""	.	-	.	-
25	""	.	-	.	-
26	15	.	-	.	-
27	""	.	-	.	-
28	""	.	-	.	-
29	""	.	-	.	-
30	""	.	-	.	-
31	20	.	-	.	-
32	""	.	-	.	-
33	""	.	-	.	-
34	""	.	-	.	-
35	""	.	-	.	-
36	25	.	-	.	-
37	""	.	-	.	-
38	""	.	-	.	-
39	""	.	-	.	-
40	""	.	-	.	-
41	Mar	.	-	.	-
42	""	.	-	.	-
43	""	.	-	.	-
44	""	.	-	.	-
45	05	.	-	.	-
46	""	.	-	.	-
47	""	.	-	.	-
48	""	.	-	.	-
49	""	.	-	.	-
50	10	.	-	.	-
51	""	.	-	.	-
52	""	.	-	.	-
53	""	.	-	.	-
54	""	.	-	.	-
55	15	.	-	.	-
56	""	.	-	.	-
57	""	.	-	.	-
58	""	.	-	.	-
59	""	.	-	.	-
60	20	.	-	.	-
61	""	.	-	.	-
62	""	.	-	.	-
63	""	.	-	.	-
64	""	.	-	.	-
65	25	.	-	.	-
66	""	.	-	.	-
67	""	.	-	.	-
68	""	.	-	.	-
69	""	.	-	.	-
70	""	.	-	.	-
71	""	.	-	.	-
72	Apr	1	-	0	-
73	""	2	-	0	-
74	""	2	-	0	-
75	""	2	-	0	-
76	05	4	-	0	-
77	""	6	-	0	-
78	""	6	-	0	-
79	""	6	1	0	0
80	""	7	1	0	0
81	10	7	0	0	0
82	""	7	1	0	0
83	""	8	1	0	0
84	""	10	0	0	0
85	""	10	1	0	0
86	15	11	1	0	0
87	""	13	0	0	0
88	""	15	2	0	0
89	""	26	2	0	0
90	""	30	3	0	0
91	20	35	4	0	0
92	""	43	5	0	0
93	""	50	5	0	0
94	""	61	7	1	0
95	""	64	7	1	0
96	25	82	8	3	1
97	""	86	8	3	0
98	""	93	8	4	1
99	""	99	8	4	0
100	""	104	8	5	1
101	""	116	8	5	1
102	May	124	9	7	0
103	""	136	7	8	1
104	""	155	10	8	1
105	""	157	9	8	0
106	05	178	12	9	1
107	""	199	13	11	1
108	""	225	16	14	1
109	""	231	15	14	1
110	""	257	17	17	2
111	10	291	20	18	1
112	""	307	21	18	1
113	""	338	23	19	2
114	""	338	20	20	1
115	""	387	23	21	1
116	15	408	25	26	2
117	""	447	27	27	1
118	""	462	25	29	2
119	""	505	28	32	2
120	""	519	26	33	2
121	20	534	28	33	2
122	""	570	26	34	2
123	""	585	25	35	1
124	""	606	23	38	1
125	""	621	23	39	2
126	25	721	31	40	1
127	""	735	31	42	1
128	""	754	31	44	2
129	""	782	30	45	1
130	""	812	33	45	2
131	""	829	32	45	1
132	""	852	33	46	1
133	Jun	861	20	46	1
134	""	865	18	46	0
135	""	896	20	46	1
136	""	909	19	47	0
137	05	914	14	47	0
138	""	929	14	47	0
139	""	946	14	48	1
140	""	969	15	48	0
141	""	1001	20	49	0
142	10	1025	18	50	1
143	""	1062	22	50	0
144	""	1085	24	50	1
145	""	1103	25	51	0
146	""	1132	27	51	1
147	15	1169	28	51	0
148	""	1176	25	51	1
149	""	1225	29	51	0
150	""	1249	27	51	0
151	""	1272	26	51	0
152	20	1298	28	53	0
153	""	1309	26	53	1
154	""	1327	22	55	0
155	""	1340	24	55	1
156	""	1347	17	55	0
157	25	1354	15	56	1
158	""	1381	16	56	1
159	""	1394	13	59	1
160	""	1410	15	59	0
161	""	1427	14	60	1
162	""	1450	16	60	1
163	Jul	1462	16	60	1
164	""	1498	21	60	0
165	""	1518	19	60	1
166	""	1524	19	62	0
167	05	1533	17	62	1
168	""	1542	17	62	0
169	""	1547	14	62	0
170	""	1572	15	63	1
171	""	1584	13	63	0
172	10	1598	11	63	0
173	""	1613	13	63	1
174	""	1618	12	63	0
175	""	1635	13	63	0
176	""	1642	14	63	0
177	15	1651	11	64	0
178	""	1668	12	64	0
179	""	1678	12	64	0
180	""	1688	10	65	1
181	""	1701	12	65	0
182	20	1711	11	65	0
183	""	1711	10	66	1
184	""	1727	11	66	0
185	""	1731	9	66	0
186	""	1752	10	66	1
187	25	1765	11	66	0
188	""	1768	10	66	0
189	""	1783	10	66	0
190	""	1783	10	66	0
191	""	1786	9	66	0
192	""	1803	10	67	0
193	""	1818	10	67	0
194	Aug	1823	8	67	0
195	""	1835	9	67	1
196	""	1843	9	67	0
197	""	1848	9	67	0
198	05	1855	10	67	0
199	""	1860	8	67	0
200	""	1877	9	68	0
201	""	1887	9	68	0
202	""	1895	8	68	0
203	10	1916	11	68	1
204	""	1917	10	69	0
205	""	1932	11	69	0
206	""	1937	11	69	0
207	""	1940	9	69	1
208	15	1947	8	69	0
209	""	1954	9	69	0
EOF

# confirmed:
set label "1954   " at first 209,195           left back textcolor "#ff8080"
# -~confirmed:
set label "9      " at first 209,  9*200/100   left back textcolor "#8080ff"
set label "33     " at first 130, 33*200/100+2 left back textcolor "#8080ff"
# deaths:
set label "69     " at first 209, 69*200/100   left back textcolor "#8080ff"
# -~deaths:
set label "0      " at first 209,  0*200/100   left back textcolor "#8080ff"
set label "2      " at first 110,  2*200/100+2 left back textcolor "#8080ff"

set multiplot
  plot $data using 0:($3/     10        ) with lines lc 7 lw 8 dt 1 title at 0.150, 0.920
replot $data using 0:($4/      1*200/100) with lines lc 6 lw 8 dt 4 title at 0.150, 0.902
replot $data using 0:($5/      1*200/100) with lines lc 6 lw 5 dt 2 title at 0.150, 0.884
replot $data using 0:($6/      1*200/100) with lines lc 6 lw 5 dt 3 title at 0.150, 0.866

# plot hor axis calendar
replot $data using 0:(0):xticlabel(2) with lines
|
File history
Click on a date/time to view the file as it appeared at that time.
| Date/Time | Thumbnail | Dimensions | User | Comment | |
|---|---|---|---|---|---|
| current | 19:35, 24 September 2020 |  | 3,300 × 1,950 (22 KB) | Jochen Burghardt (talk | contribs) | =={{int:filedesc}}== {{Information |description={{en|1=Diagram of WHO COVID-19 daily data (20 Jan - 16 Aug 2020) for ''"Total Confirmed Cases"'' (thick solid line), its smoothed increment (thick dash-dotted line), ''"Total Deaths"'' (thin dashed line), and its smoothed increment (thin dotted line); see File:WHO_Covid_2020_Jan-Aug_daily_C_Afghanistan.pdf for details.}} |date=2020-09-24 |source={{own}} |author=Jochen Burghardt |permission= |other_versions=[[:File:... |
You cannot overwrite this file.
File usage on Commons
There are no pages that use this file.