File:WHO Covid 2020 Jan-Aug daily C Puerto Rico.pdf
Jump to navigation
Jump to search

Size of this JPG preview of this PDF file: 800 × 473 pixels. Other resolutions: 320 × 189 pixels | 640 × 378 pixels | 1,024 × 605 pixels | 1,280 × 756 pixels | 3,300 × 1,950 pixels.
Original file (3,300 × 1,950 pixels, file size: 24 KB, MIME type: application/pdf)
Captions
Captions
Add a one-line explanation of what this file represents
Summary
[edit]| Description |
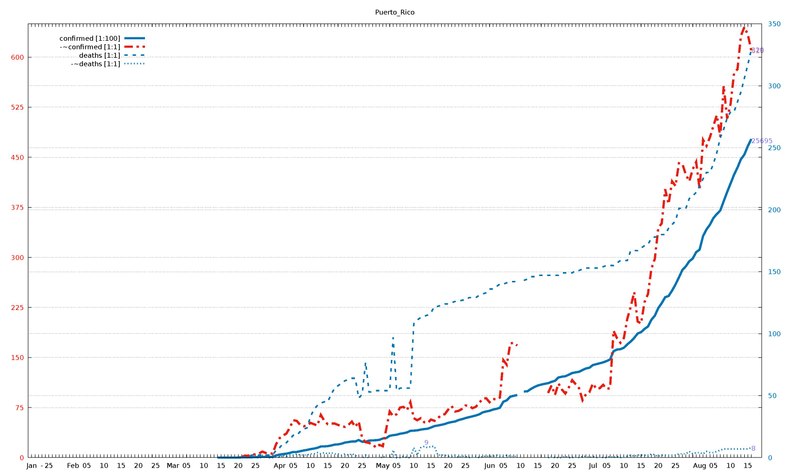
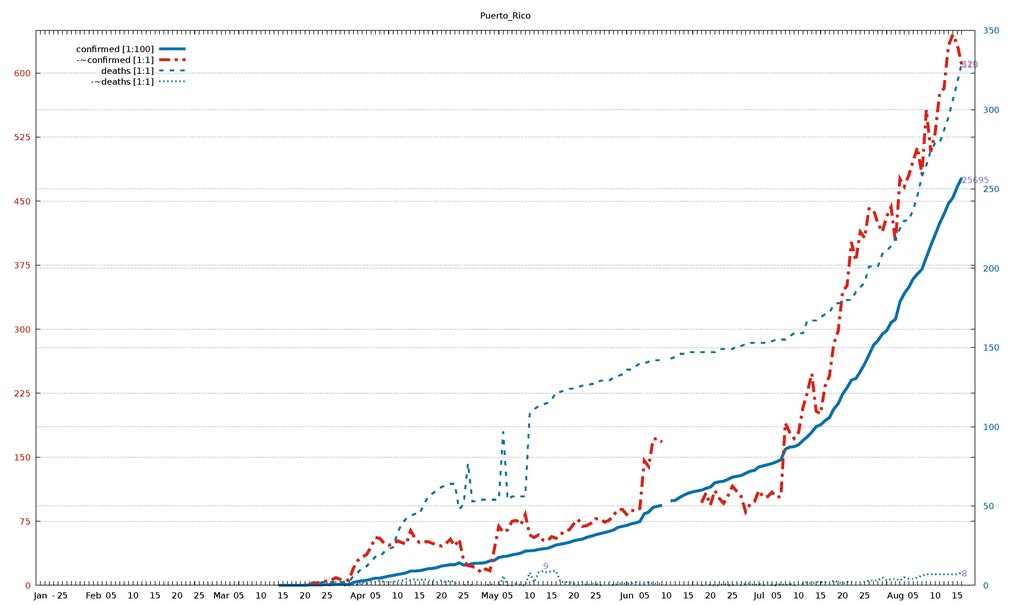
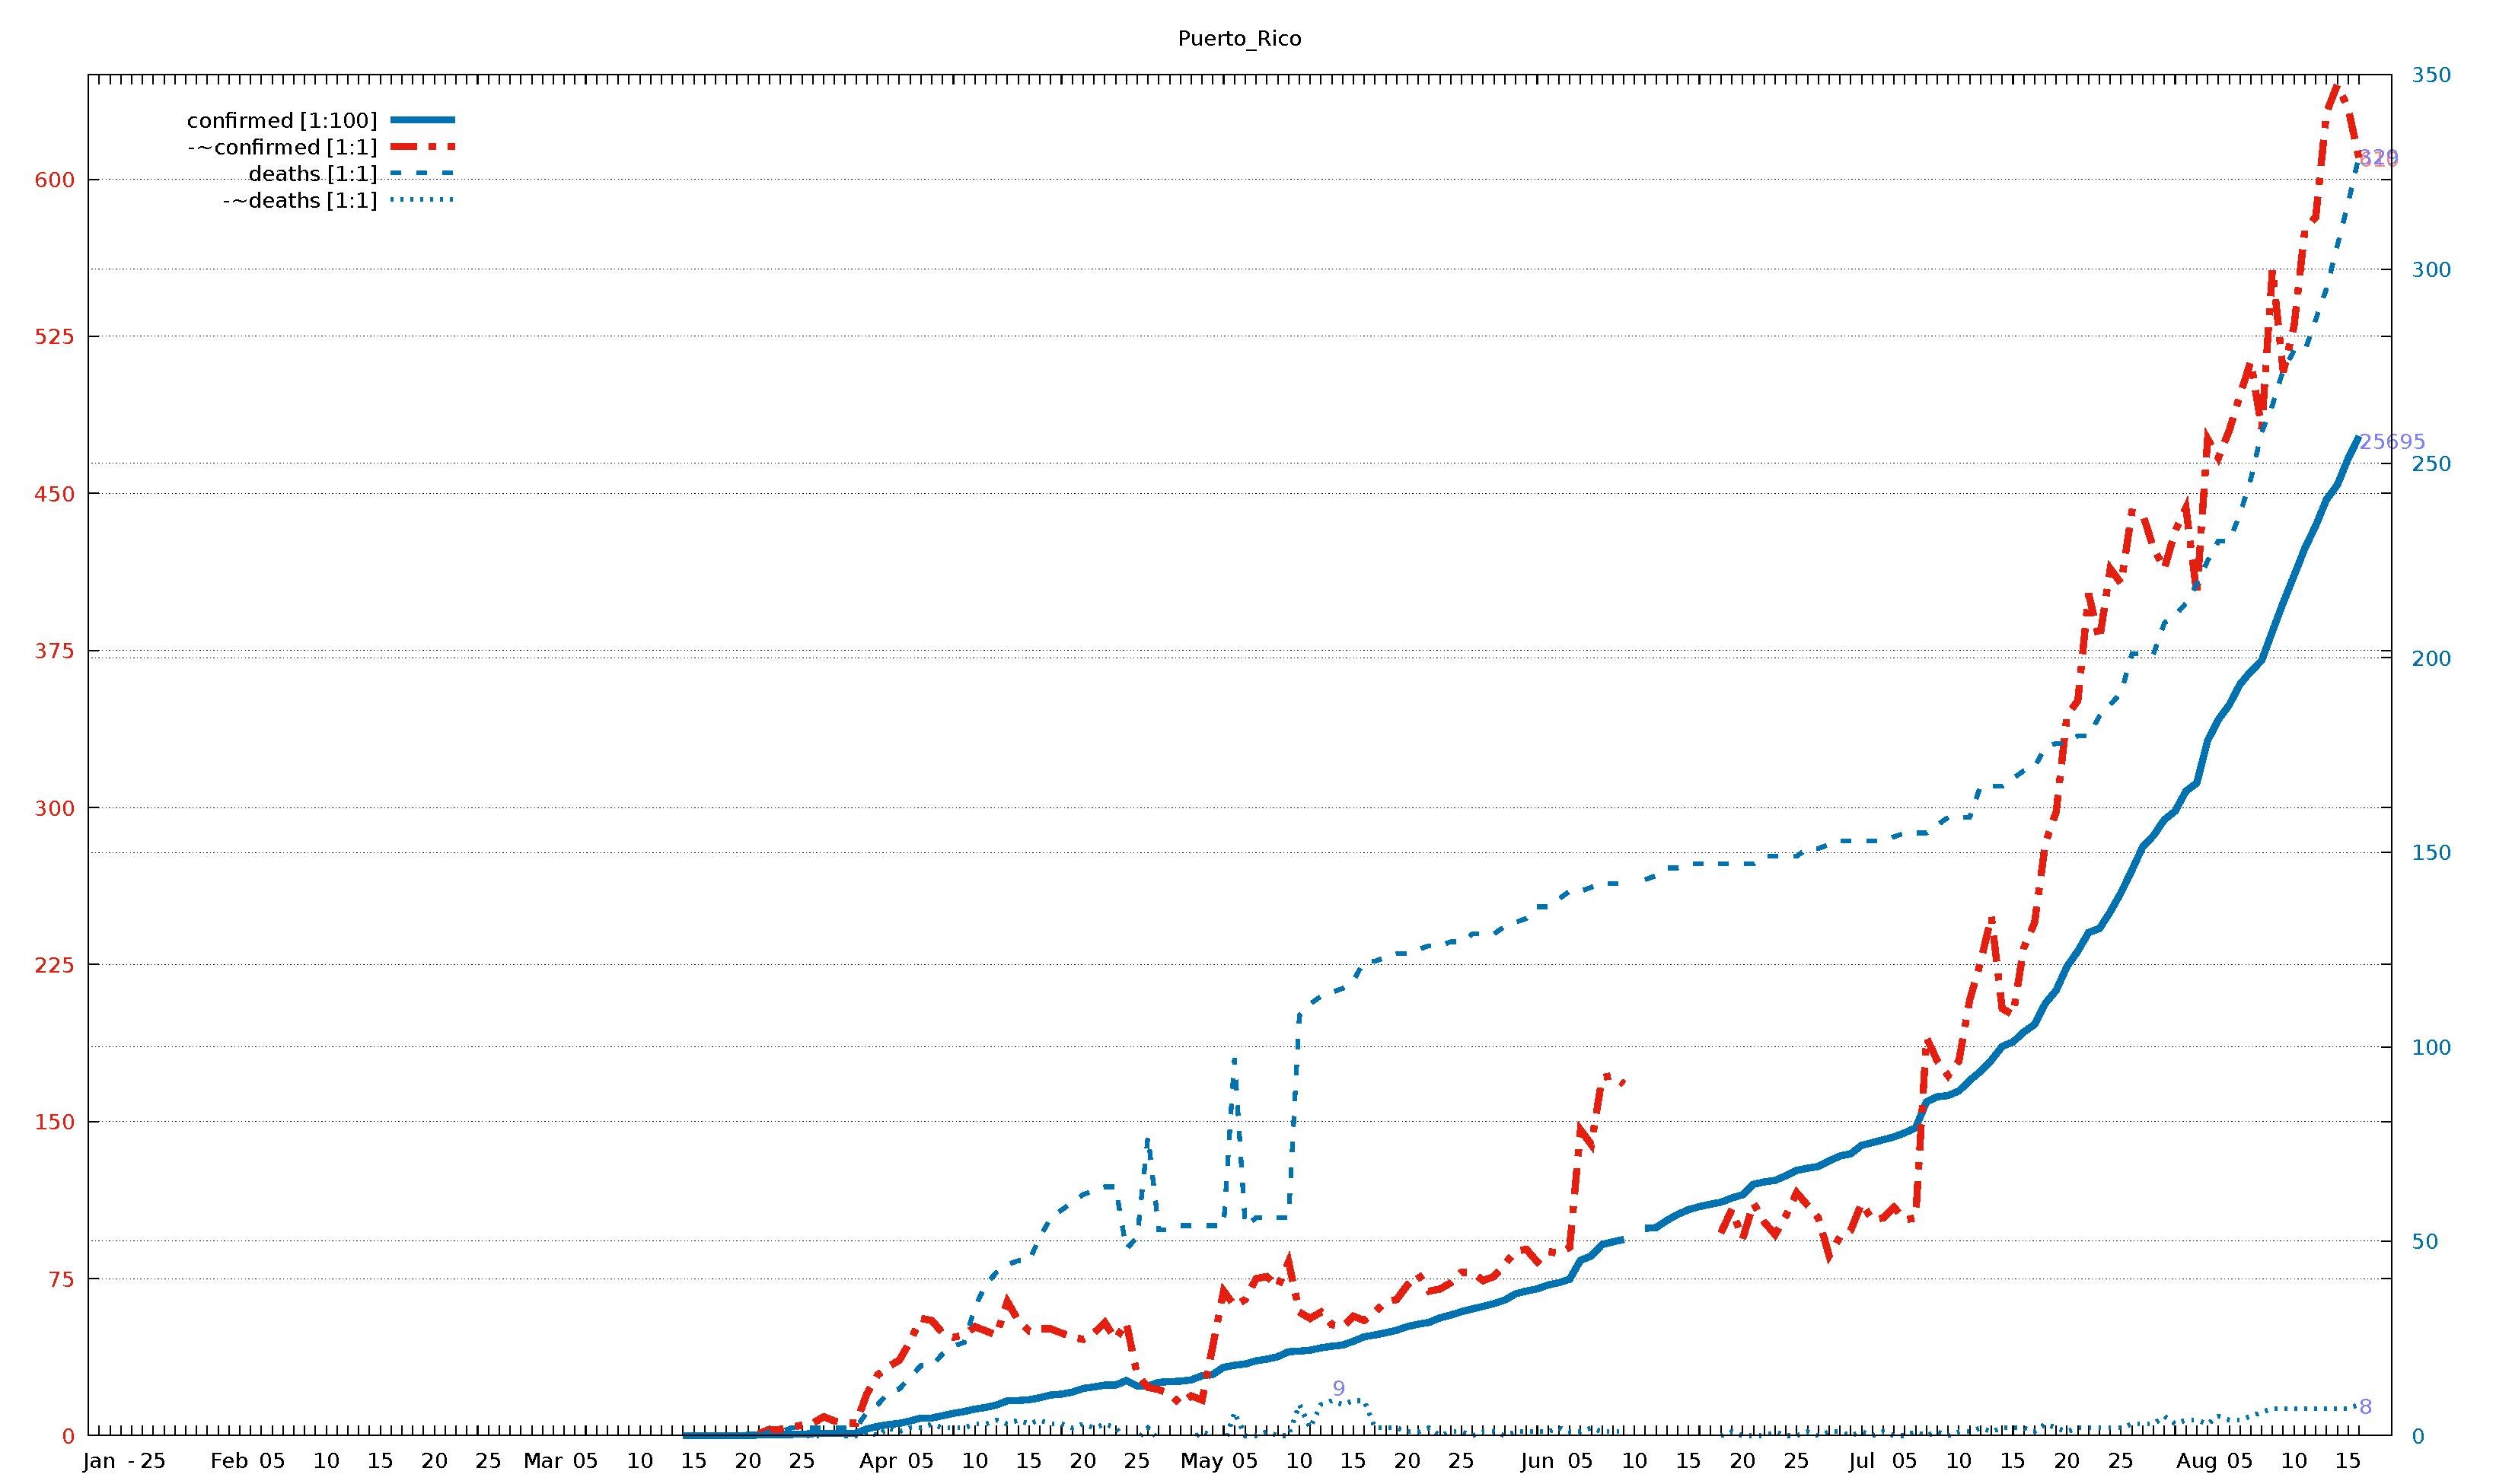
English: Diagram of WHO COVID-19 daily data (20 Jan - 16 Aug 2020) for "Total Confirmed Cases" (thick solid line), its smoothed increment (thick dash-dotted line), "Total Deaths" (thin dashed line) , and its smoothed increment (thin dotted line). Figures are taken from the available situation reports. Red and blue lines refer to the left and right vertical axis, respectively; the scaling factor for each curve is given in the legend. The horizontal axis starts on 20 Jan 2020 (situation report 1), and ends on 16 Aug 2020 (situation report 209). In the smoothed curves, for each day, 1/7 of the difference of the current day's figure and the figure a week ago is shown. For example, in situation report 115 (14 May 2020) and 121 (21 May 2020), there were 8676 and 5339 Total Confirmed Cases in Afghanistan, respectively, so the thick dash-dotted line passes through 477 = (8676-5339)/7 on 21 May.
For an overview of all related visualizations, and a more detailled description, see WHO Covid diagram set#Available country diagrams Jan-Aug 2020 (daily). |
| Date | |
| Source | Own work |
| Author | Jochen Burghardt |
Licensing
[edit]I, the copyright holder of this work, hereby publish it under the following license:
This file is licensed under the Creative Commons Attribution-Share Alike 4.0 International license.
- You are free:
- to share – to copy, distribute and transmit the work
- to remix – to adapt the work
- Under the following conditions:
- attribution – You must give appropriate credit, provide a link to the license, and indicate if changes were made. You may do so in any reasonable manner, but not in any way that suggests the licensor endorses you or your use.
- share alike – If you remix, transform, or build upon the material, you must distribute your contributions under the same or compatible license as the original.
Gnuplot source code
[edit]| Gnuplot source code |
|---|
set term pdf size 22,13
set term pdf font "sans,20"
set output "WHO_Covid_C_Puerto_Rico.pdf"
set key autotitle columnhead
set termoption noenhanced
# (1) norm: 257 645 329 001
# (2) dist: 1,0:251 2,0:128 2,1:196
# (3,4) dist max: 251 1:645--0:257
# (4) right: 1 0 1 1
# (6,7) scMax: 650 350
# (8) scale: [1:100] [1:1] [1:1] [1:1]


set xrange [-1:212]
set yrange [0:650]
set y2range [0:350]
set xtics 3650,100
set ytics 75 textcolor "#e51e10"
set y2tics 50 textcolor "#0072b2"
set grid y y2

set title "Puerto_Rico"

$data <<EOF
rep day "confirmed [1:100]" "-~confirmed [1:1]" "deaths [1:1]" "-~deaths [1:1]"
1	Jan	.	-	.	-
2	""	.	-	.	-
3	""	.	-	.	-
-	-	-	-	-	-
4	""	.	-	.	-
5	25	.	-	.	-
6	""	.	-	.	-
7	""	.	-	.	-
8	""	.	-	.	-
9	""	.	-	.	-
10	""	.	-	.	-
11	""	.	-	.	-
12	Feb	.	-	.	-
13	""	.	-	.	-
14	""	.	-	.	-
15	""	.	-	.	-
16	05	.	-	.	-
17	""	.	-	.	-
18	""	.	-	.	-
19	""	.	-	.	-
20	""	.	-	.	-
21	10	.	-	.	-
22	""	.	-	.	-
23	""	.	-	.	-
24	""	.	-	.	-
25	""	.	-	.	-
26	15	.	-	.	-
27	""	.	-	.	-
28	""	.	-	.	-
29	""	.	-	.	-
30	""	.	-	.	-
31	20	.	-	.	-
32	""	.	-	.	-
33	""	.	-	.	-
34	""	.	-	.	-
35	""	.	-	.	-
36	25	.	-	.	-
37	""	.	-	.	-
38	""	.	-	.	-
39	""	.	-	.	-
40	""	.	-	.	-
41	Mar	.	-	.	-
42	""	.	-	.	-
43	""	.	-	.	-
44	""	.	-	.	-
45	05	.	-	.	-
46	""	.	-	.	-
47	""	.	-	.	-
48	""	.	-	.	-
49	""	.	-	.	-
50	10	.	-	.	-
51	""	.	-	.	-
52	""	.	-	.	-
53	""	.	-	.	-
54	""	3	-	0	-
55	15	3	-	0	-
56	""	3	-	0	-
57	""	3	-	0	-
58	""	3	-	0	-
59	""	5	-	0	-
60	20	6	-	0	-
61	""	14	1	0	0
62	""	21	3	1	0
63	""	23	3	1	0
64	""	31	4	2	1
65	25	39	5	2	0
66	""	51	6	2	0
67	""	64	9	2	0
68	""	64	7	2	1
69	""	64	6	2	0
70	""	64	6	2	0
71	""	174	20	6	1
72	Apr	239	29	8	0
73	""	286	33	11	2
74	""	316	36	12	1
75	""	378	45	15	2
76	05	452	56	18	2
77	""	452	55	18	3
78	""	513	49	21	2
79	""	573	47	23	2
80	""	620	48	24	2
81	10	683	52	33	3
82	""	725	50	39	3
83	""	788	48	42	4
84	""	897	64	44	3
85	""	903	55	45	4
86	15	923	50	45	3
87	""	974	51	51	4
88	""	1043	51	56	3
89	""	1068	49	58	3
90	""	1118	47	60	2
91	20	1213	46	62	3
92	""	1252	49	63	2
93	""	1298	54	64	3
94	""	1298	46	64	2
95	""	1416	54	48	-1
96	25	1276	29	51	-1
97	""	1276	23	77	2
98	""	1371	22	53	-1
99	""	1389	20	53	-1
100	""	1400	15	54	-2
101	""	1433	19	54	-1
102	May	1539	17	54	1
103	""	1575	43	54	0
104	""	1757	69	54	-3
105	""	1808	62	97	6
106	05	1843	65	54	0
107	""	1924	75	56	0
108	""	1968	76	56	1
109	""	2031	71	56	0
110	""	2156	83	56	0
111	10	2173	59	108	8
112	""	2198	56	111	2
113	""	2256	59	113	8
114	""	2299	53	114	9
115	""	2329	52	115	8
116	15	2427	57	117	9
117	""	2542	55	122	9
118	""	2589	59	122	2
119	""	2646	64	123	2
120	""	2710	65	124	2
121	20	2805	72	124	1
122	""	2866	77	125	1
123	""	2913	69	126	2
124	""	3030	70	126	0
125	""	3100	73	127	1
126	25	3189	78	127	1
127	""	3260	78	129	0
128	""	3324	74	129	1
129	""	3397	76	129	1
130	""	3486	82	131	0
131	""	3647	88	132	1
132	""	3718	89	133	1
133	Jun	3776	83	136	1
134	""	3873	88	136	1
135	""	3935	87	138	2
136	""	4023	90	140	1
137	05	4508	146	140	1
138	""	4620	139	141	2
139	""	4915	171	142	1
140	""	4985	172	142	1
141	""	5046	168	142	1
142	10	.	-	.	-
143	""	5329	-	143	-
144	""	5352	-	144	-
145	""	5536	-	146	-
146	""	5690	-	146	-
147	15	5811	-	147	-
148	""	5890	-	147	-
149	""	5951	-	147	-
150	""	6003	97	147	0
151	""	6111	108	147	1
152	20	6195	94	147	0
153	""	6463	111	147	0
154	""	6525	102	149	0
155	""	6564	96	149	1
156	""	6685	105	149	0
157	25	6820	116	149	0
158	""	6877	110	151	1
159	""	6922	104	151	0
160	""	7066	86	152	1
161	""	7189	95	153	1
162	""	7250	98	153	0
163	Jul	7465	111	153	1
164	""	7537	103	153	0
165	""	7608	104	153	1
166	""	7683	109	154	0
167	05	7787	103	155	0
168	""	7916	104	155	1
169	""	8585	190	155	0
170	""	8714	179	157	1
171	""	8745	172	159	0
172	10	8862	179	159	1
173	""	9137	208	159	1
174	""	9366	226	167	2
175	""	9654	248	167	1
176	""	10010	204	167	2
177	15	10123	201	169	2
178	""	10379	233	171	2
179	""	10574	245	172	1
180	""	11120	283	177	3
181	""	11453	298	178	2
182	20	12063	344	178	1
183	""	12461	351	180	2
184	""	12940	402	180	2
185	""	13038	380	185	2
186	""	13473	414	188	2
187	25	13967	407	191	2
188	""	14540	441	201	3
189	""	15143	440	201	3
190	""	15431	424	201	3
191	""	15840	414	209	5
192	""	16061	432	211	3
193	""	16572	443	214	4
194	Aug	16781	402	219	4
195	""	17872	476	225	3
196	""	18411	467	230	5
197	""	18791	480	230	4
198	05	19324	497	237	4
199	""	19651	513	246	5
200	""	19934	481	258	6
201	""	20686	557	265	7
202	""	21424	508	274	7
203	10	22121	530	279	7
204	""	22821	576	279	7
205	""	23403	582	287	7
206	""	24074	632	295	7
207	""	24446	645	306	7
208	15	25128	634	317	7
209	""	25695	610	329	8
EOF

# confirmed:
set label "25695  " at first 209,256*650/350   left back textcolor "#8080ff"
# -~confirmed:
set label "610    " at first 209,610           left back textcolor "#ff8080"
# deaths:
set label "329    " at first 209,329*650/350   left back textcolor "#8080ff"
# -~deaths:
set label "8      " at first 209,  8*650/350   left back textcolor "#8080ff"
set label "9      " at first 114,  9*650/350+7 left back textcolor "#8080ff"

set multiplot
  plot $data using 0:($3/    100*650/350) with lines lc 6 lw 8 dt 1 title at 0.150, 0.920
replot $data using 0:($4/      1        ) with lines lc 7 lw 8 dt 4 title at 0.150, 0.902
replot $data using 0:($5/      1*650/350) with lines lc 6 lw 5 dt 2 title at 0.150, 0.884
replot $data using 0:($6/      1*650/350) with lines lc 6 lw 5 dt 3 title at 0.150, 0.866

# plot hor axis calendar
replot $data using 0:(0):xticlabel(2) with lines
|
File history
Click on a date/time to view the file as it appeared at that time.
| Date/Time | Thumbnail | Dimensions | User | Comment | |
|---|---|---|---|---|---|
| current | 19:31, 24 September 2020 |  | 3,300 × 1,950 (24 KB) | Jochen Burghardt (talk | contribs) | =={{int:filedesc}}== {{Information |description={{en|1=Diagram of WHO COVID-19 daily data (20 Jan - 16 Aug 2020) for ''"Total Confirmed Cases"'' (thick solid line), its smoothed increment (thick dash-dotted line), ''"Total Deaths"'' (thin dashed line), and its smoothed increment (thin dotted line); see File:WHO_Covid_2020_Jan-Aug_daily_C_Afghanistan.pdf for details.}} |date=2020-09-24 |source={{own}} |author=Jochen Burghardt |permission= |other_versions=[[:File:... |
You cannot overwrite this file.
File usage on Commons
There are no pages that use this file.