File:WHO Covid 2020 Jan-Aug daily C Montenegro.pdf
Jump to navigation
Jump to search

Size of this JPG preview of this PDF file: 800 × 473 pixels. Other resolutions: 320 × 189 pixels | 640 × 378 pixels | 1,024 × 605 pixels | 1,280 × 756 pixels | 3,300 × 1,950 pixels.
Original file (3,300 × 1,950 pixels, file size: 21 KB, MIME type: application/pdf)
Captions
Captions
Add a one-line explanation of what this file represents
Summary
[edit]| Description |
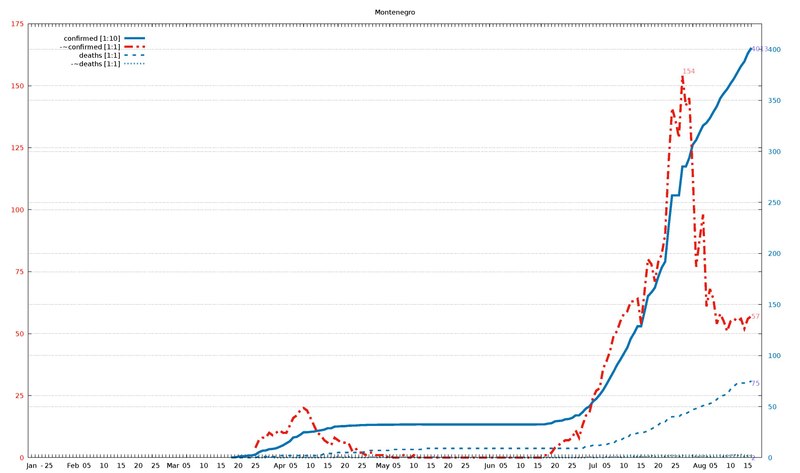
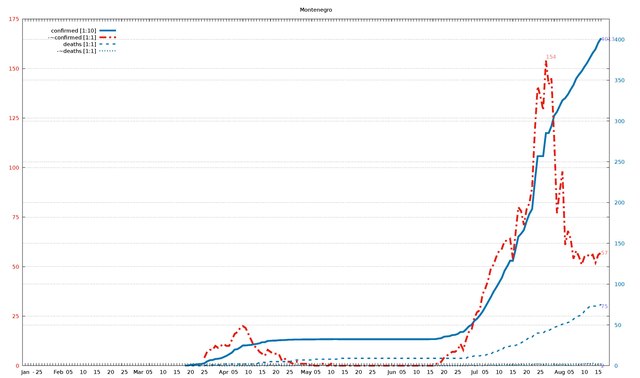
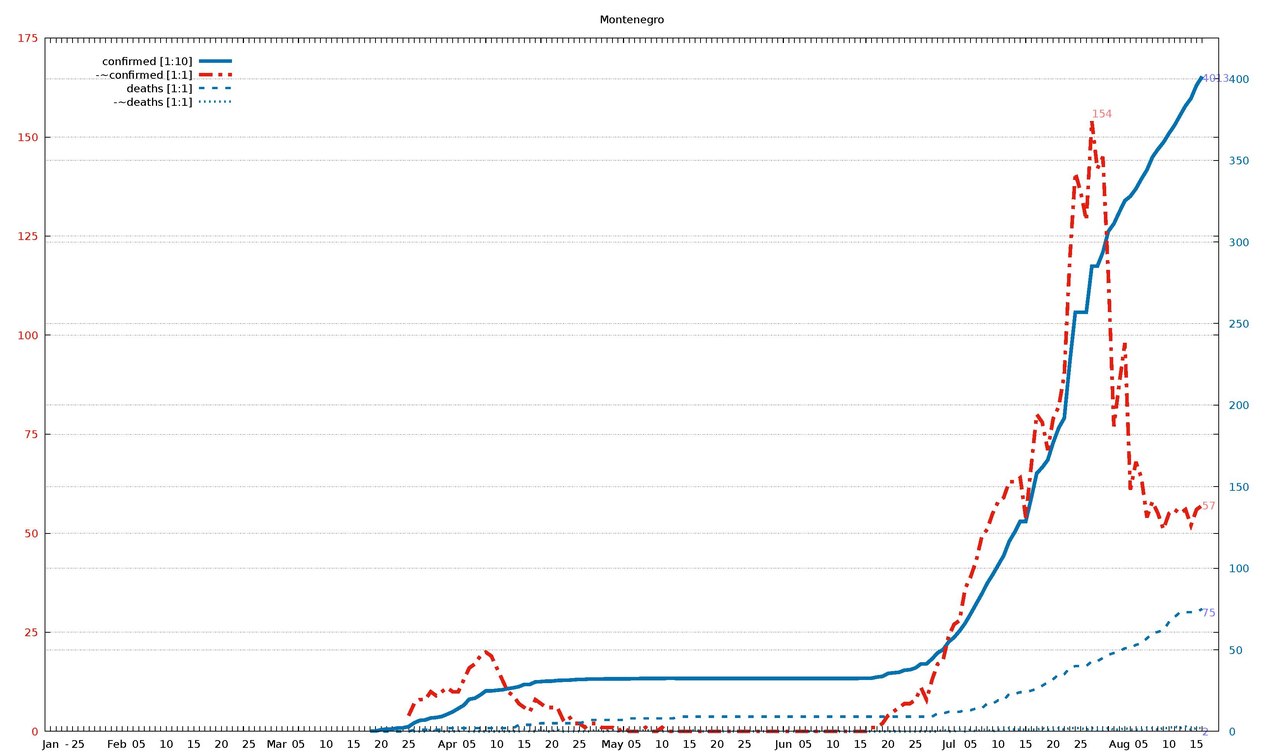
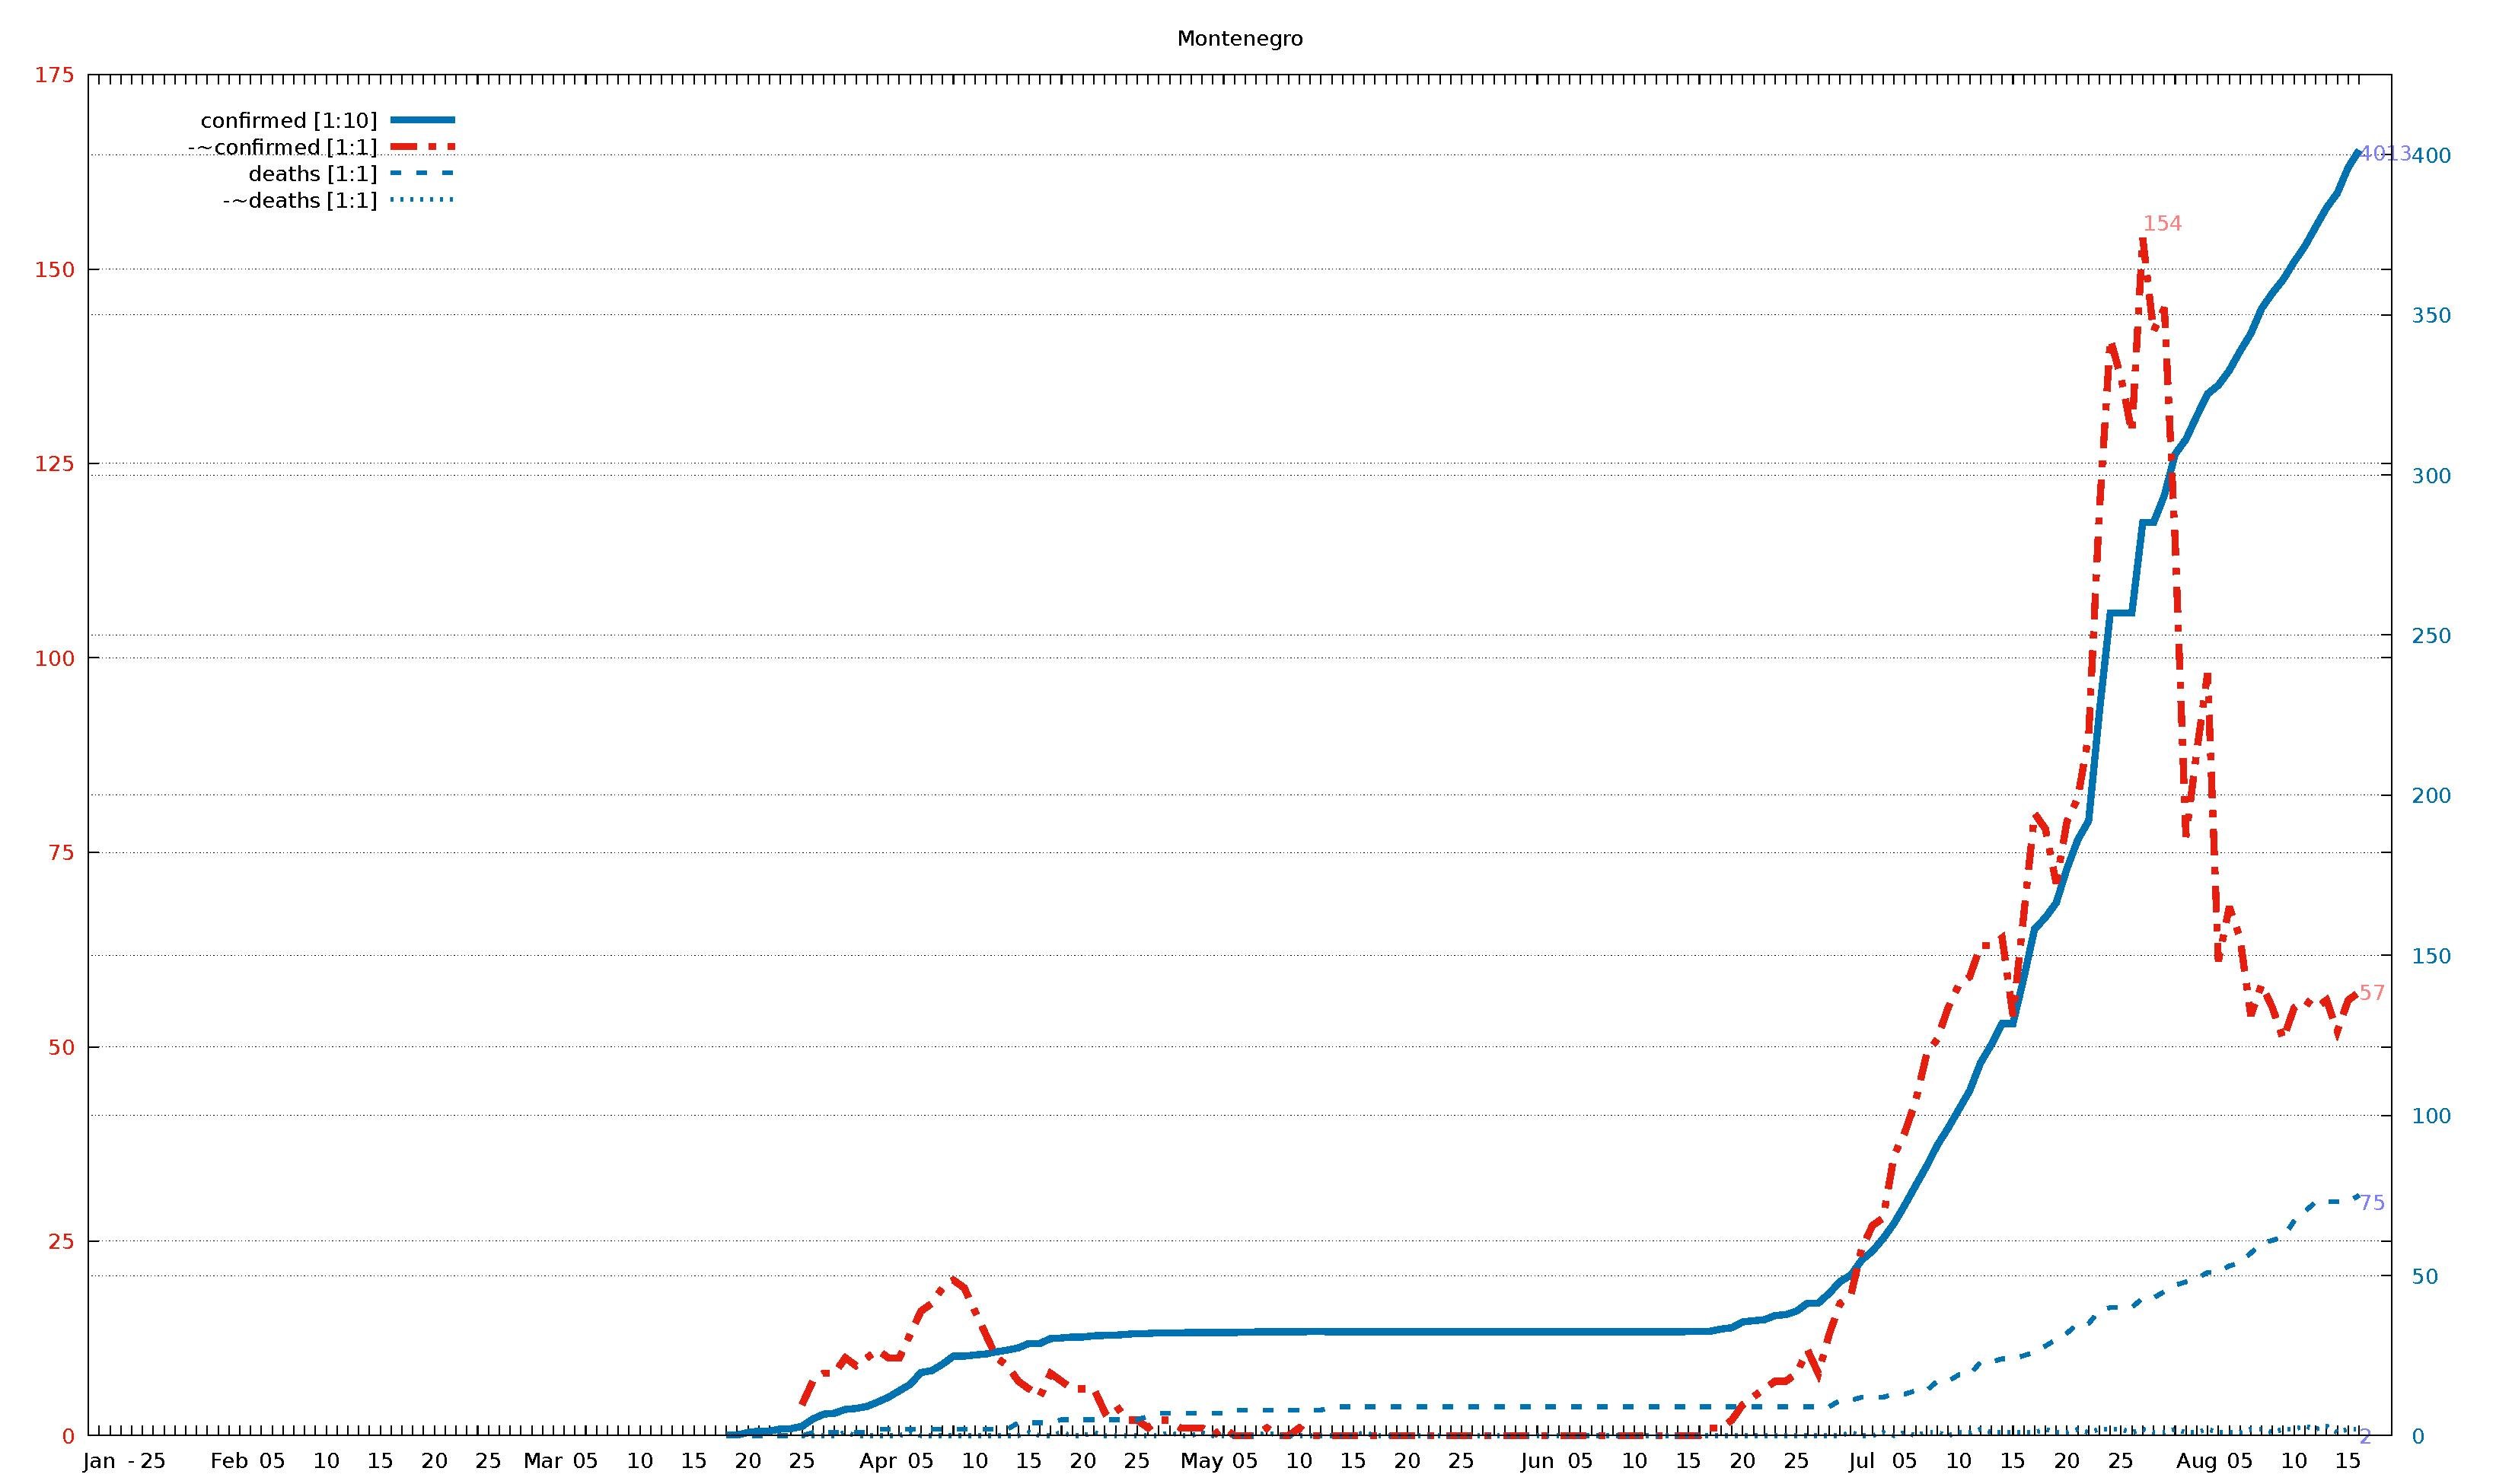
English: Diagram of WHO COVID-19 daily data (20 Jan - 16 Aug 2020) for "Total Confirmed Cases" (thick solid line), its smoothed increment (thick dash-dotted line), "Total Deaths" (thin dashed line) , and its smoothed increment (thin dotted line). Figures are taken from the available situation reports. Red and blue lines refer to the left and right vertical axis, respectively; the scaling factor for each curve is given in the legend. The horizontal axis starts on 20 Jan 2020 (situation report 1), and ends on 16 Aug 2020 (situation report 209). In the smoothed curves, for each day, 1/7 of the difference of the current day's figure and the figure a week ago is shown. For example, in situation report 115 (14 May 2020) and 121 (21 May 2020), there were 8676 and 5339 Total Confirmed Cases in Afghanistan, respectively, so the thick dash-dotted line passes through 477 = (8676-5339)/7 on 21 May.
For an overview of all related visualizations, and a more detailled description, see WHO Covid diagram set#Available country diagrams Jan-Aug 2020 (daily). |
| Date | |
| Source | Own work |
| Author | Jochen Burghardt |
Licensing
[edit]I, the copyright holder of this work, hereby publish it under the following license:
This file is licensed under the Creative Commons Attribution-Share Alike 4.0 International license.
- You are free:
- to share – to copy, distribute and transmit the work
- to remix – to adapt the work
- Under the following conditions:
- attribution – You must give appropriate credit, provide a link to the license, and indicate if changes were made. You may do so in any reasonable manner, but not in any way that suggests the licensor endorses you or your use.
- share alike – If you remix, transform, or build upon the material, you must distribute your contributions under the same or compatible license as the original.
Gnuplot source code
[edit]| Gnuplot source code |
|---|
set term pdf size 22,13
set term pdf font "sans,20"
set output "WHO_Covid_C_Montenegro.pdf"
set key autotitle columnhead
set termoption noenhanced
# (1) norm: 402 154 001 001
# (2) dist: 1,0:261
# (3,4) dist max: 261 1:154--0:402
# (4) right: 1 0 1 1
# (6,7) scMax: 175 425
# (8) scale: [1:10] [1:1] [1:1] [1:1]


set xrange [-1:212]
set yrange [0:175]
set y2range [0:425]
set xtics 3650,100
set ytics 25 textcolor "#e51e10"
set y2tics 50 textcolor "#0072b2"
set grid y y2

set title "Montenegro"

$data <<EOF
rep day "confirmed [1:10]" "-~confirmed [1:1]" "deaths [1:1]" "-~deaths [1:1]"
1	Jan	.	-	.	-
2	""	.	-	.	-
3	""	.	-	.	-
-	-	-	-	-	-
4	""	.	-	.	-
5	25	.	-	.	-
6	""	.	-	.	-
7	""	.	-	.	-
8	""	.	-	.	-
9	""	.	-	.	-
10	""	.	-	.	-
11	""	.	-	.	-
12	Feb	.	-	.	-
13	""	.	-	.	-
14	""	.	-	.	-
15	""	.	-	.	-
16	05	.	-	.	-
17	""	.	-	.	-
18	""	.	-	.	-
19	""	.	-	.	-
20	""	.	-	.	-
21	10	.	-	.	-
22	""	.	-	.	-
23	""	.	-	.	-
24	""	.	-	.	-
25	""	.	-	.	-
26	15	.	-	.	-
27	""	.	-	.	-
28	""	.	-	.	-
29	""	.	-	.	-
30	""	.	-	.	-
31	20	.	-	.	-
32	""	.	-	.	-
33	""	.	-	.	-
34	""	.	-	.	-
35	""	.	-	.	-
36	25	.	-	.	-
37	""	.	-	.	-
38	""	.	-	.	-
39	""	.	-	.	-
40	""	.	-	.	-
41	Mar	.	-	.	-
42	""	.	-	.	-
43	""	.	-	.	-
44	""	.	-	.	-
45	05	.	-	.	-
46	""	.	-	.	-
47	""	.	-	.	-
48	""	.	-	.	-
49	""	.	-	.	-
50	10	.	-	.	-
51	""	.	-	.	-
52	""	.	-	.	-
53	""	.	-	.	-
54	""	.	-	.	-
55	15	.	-	.	-
56	""	.	-	.	-
57	""	.	-	.	-
58	""	2	-	0	-
59	""	2	-	0	-
60	20	10	-	0	-
61	""	14	-	0	-
62	""	14	-	0	-
63	""	21	-	0	-
64	""	22	-	0	-
65	25	29	4	0	0
66	""	52	7	1	0
67	""	67	8	1	0
68	""	70	8	1	0
69	""	82	10	1	1
70	""	85	9	1	0
71	""	91	10	1	0
72	Apr	105	11	2	0
73	""	120	10	2	0
74	""	140	10	2	0
75	""	160	13	2	1
76	05	197	16	2	0
77	""	203	17	2	0
78	""	223	19	2	0
79	""	248	20	2	0
80	""	248	19	2	0
81	10	252	16	2	0
82	""	255	13	2	0
83	""	262	10	2	0
84	""	267	9	2	0
85	""	274	7	4	0
86	15	288	6	4	1
87	""	288	5	4	0
88	""	303	8	4	0
89	""	305	7	5	1
90	""	308	6	5	0
91	20	308	6	5	0
92	""	312	6	5	1
93	""	313	3	5	0
94	""	314	4	5	0
95	""	316	2	5	0
96	25	319	2	5	0
97	""	319	1	6	0
98	""	321	2	7	0
99	""	321	2	7	1
100	""	321	1	7	0
101	""	322	1	7	0
102	May	322	1	7	1
103	""	322	0	7	0
104	""	322	1	7	0
105	""	322	0	8	0
106	05	323	0	8	0
107	""	324	0	8	0
108	""	324	1	8	1
109	""	324	0	8	0
110	""	324	0	8	0
111	10	324	1	8	0
112	""	325	0	8	0
113	""	325	0	8	0
114	""	324	0	9	0
115	""	324	0	9	0
116	15	324	0	9	0
117	""	324	0	9	1
118	""	324	0	9	0
119	""	324	0	9	0
120	""	324	0	9	0
121	20	324	0	9	0
122	""	324	0	9	0
123	""	324	0	9	0
124	""	324	0	9	0
125	""	324	0	9	0
126	25	324	0	9	0
127	""	324	0	9	0
128	""	324	0	9	0
129	""	324	0	9	0
130	""	324	0	9	0
131	""	324	0	9	0
132	""	324	0	9	0
133	Jun	324	0	9	0
134	""	324	0	9	0
135	""	324	0	9	0
136	""	324	0	9	0
137	05	324	0	9	0
138	""	324	0	9	0
139	""	324	0	9	0
140	""	324	0	9	0
141	""	324	0	9	0
142	10	324	0	9	0
143	""	324	0	9	0
144	""	324	0	9	0
145	""	324	0	9	0
146	""	324	0	9	0
147	15	325	0	9	0
148	""	326	0	9	0
149	""	326	1	9	0
150	""	333	1	9	0
151	""	337	2	9	0
152	20	355	4	9	0
153	""	359	5	9	0
154	""	362	6	9	0
155	""	375	7	9	0
156	""	378	7	9	0
157	25	389	8	9	0
158	""	414	11	9	0
159	""	414	8	9	0
160	""	444	13	9	0
161	""	481	17	11	0
162	""	501	18	11	1
163	Jul	548	24	12	0
164	""	576	27	12	0
165	""	616	28	12	1
166	""	663	36	13	0
167	05	720	39	13	1
168	""	781	43	14	0
169	""	841	49	14	1
170	""	907	51	17	1
171	""	960	55	17	0
172	10	1019	58	19	1
173	""	1077	59	19	1
174	""	1164	63	23	2
175	""	1221	63	23	1
176	""	1287	64	24	1
177	15	1287	54	24	1
178	""	1429	67	25	1
179	""	1582	80	26	1
180	""	1618	78	28	2
181	""	1664	71	30	1
182	20	1771	79	32	1
183	""	1861	82	35	2
184	""	1920	90	35	1
185	""	2261	119	39	2
186	""	2569	141	40	2
187	25	2569	136	40	2
188	""	2569	129	40	1
189	""	2851	154	43	2
190	""	2851	142	43	1
191	""	2936	145	45	1
192	""	3065	115	47	2
193	""	3111	77	48	1
194	Aug	3184	88	49	1
195	""	3253	98	51	2
196	""	3280	61	51	1
197	""	3326	68	53	1
198	05	3386	64	54	1
199	""	3441	54	57	2
200	""	3520	58	60	2
201	""	3568	55	61	1
202	""	3610	51	62	2
203	10	3665	55	67	2
204	""	3714	56	70	3
205	""	3775	55	73	2
206	""	3834	56	73	3
207	""	3880	52	73	1
208	15	3960	56	73	2
209	""	4013	57	75	2
EOF

# confirmed:
set label "4013   " at first 209,401*175/425   left back textcolor "#8080ff"
# -~confirmed:
set label "57     " at first 209, 57           left back textcolor "#ff8080"
set label "154    " at first 189,154        +2 left back textcolor "#ff8080"
# deaths:
set label "75     " at first 209, 75*175/425   left back textcolor "#8080ff"
# -~deaths:
set label "2      " at first 209,  2*175/425   left back textcolor "#8080ff"

set multiplot
  plot $data using 0:($3/     10*175/425) with lines lc 6 lw 8 dt 1 title at 0.150, 0.920
replot $data using 0:($4/      1        ) with lines lc 7 lw 8 dt 4 title at 0.150, 0.902
replot $data using 0:($5/      1*175/425) with lines lc 6 lw 5 dt 2 title at 0.150, 0.884
replot $data using 0:($6/      1*175/425) with lines lc 6 lw 5 dt 3 title at 0.150, 0.866

# plot hor axis calendar
replot $data using 0:(0):xticlabel(2) with lines
|
File history
Click on a date/time to view the file as it appeared at that time.
| Date/Time | Thumbnail | Dimensions | User | Comment | |
|---|---|---|---|---|---|
| current | 19:23, 24 September 2020 |  | 3,300 × 1,950 (21 KB) | Jochen Burghardt (talk | contribs) | =={{int:filedesc}}== {{Information |description={{en|1=Diagram of WHO COVID-19 daily data (20 Jan - 16 Aug 2020) for ''"Total Confirmed Cases"'' (thick solid line), its smoothed increment (thick dash-dotted line), ''"Total Deaths"'' (thin dashed line), and its smoothed increment (thin dotted line); see File:WHO_Covid_2020_Jan-Aug_daily_C_Afghanistan.pdf for details.}} |date=2020-09-24 |source={{own}} |author=Jochen Burghardt |permission= |other_versions=[[:File:... |
You cannot overwrite this file.
File usage on Commons
There are no pages that use this file.