File:WHO Covid 2020 Jan-Aug daily C Eswatini.pdf
Jump to navigation
Jump to search

Size of this JPG preview of this PDF file: 800 × 473 pixels. Other resolutions: 320 × 189 pixels | 640 × 378 pixels | 1,024 × 605 pixels | 1,280 × 756 pixels | 3,300 × 1,950 pixels.
Original file (3,300 × 1,950 pixels, file size: 22 KB, MIME type: application/pdf)
Captions
Captions
Add a one-line explanation of what this file represents
Summary
[edit]| Description |
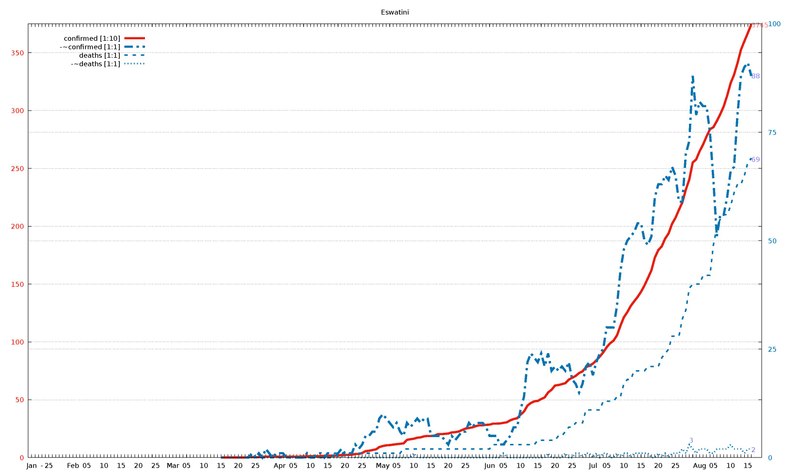
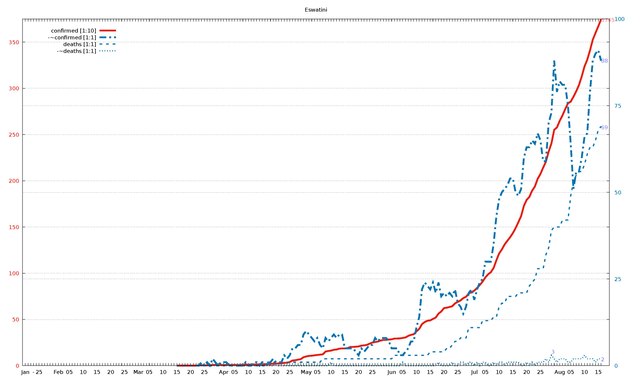
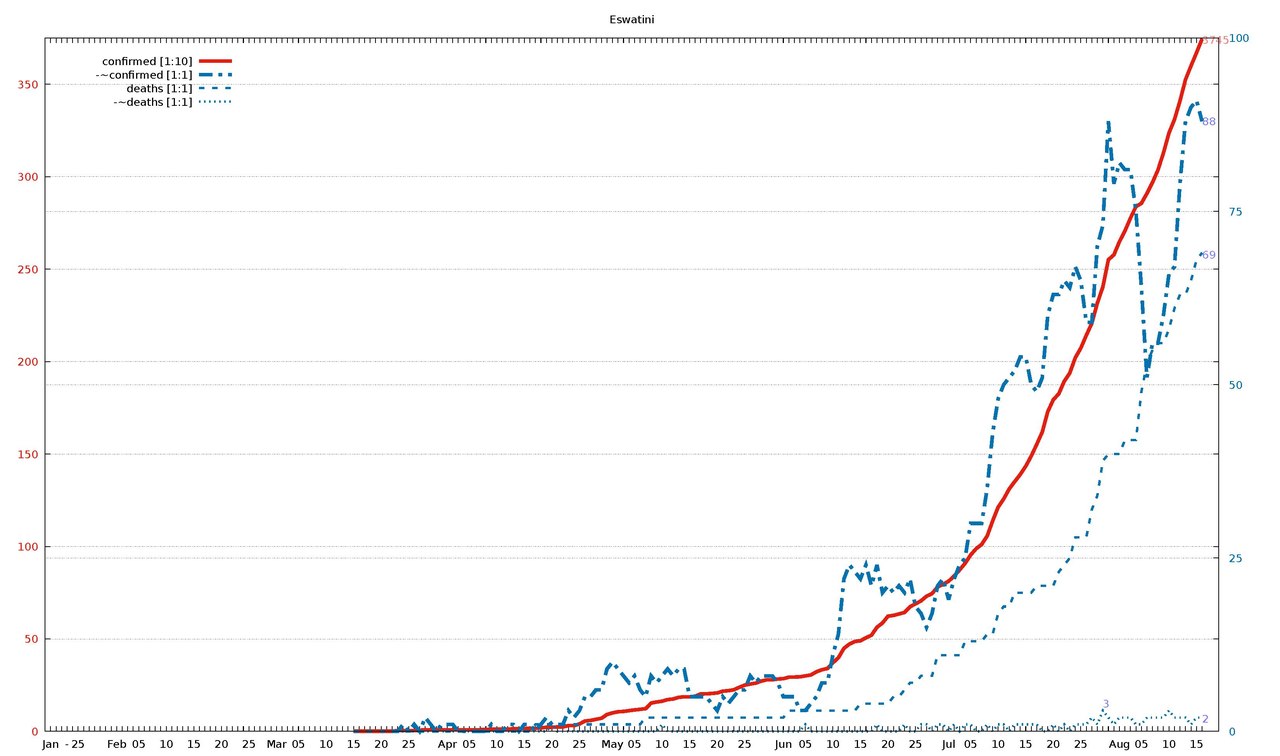
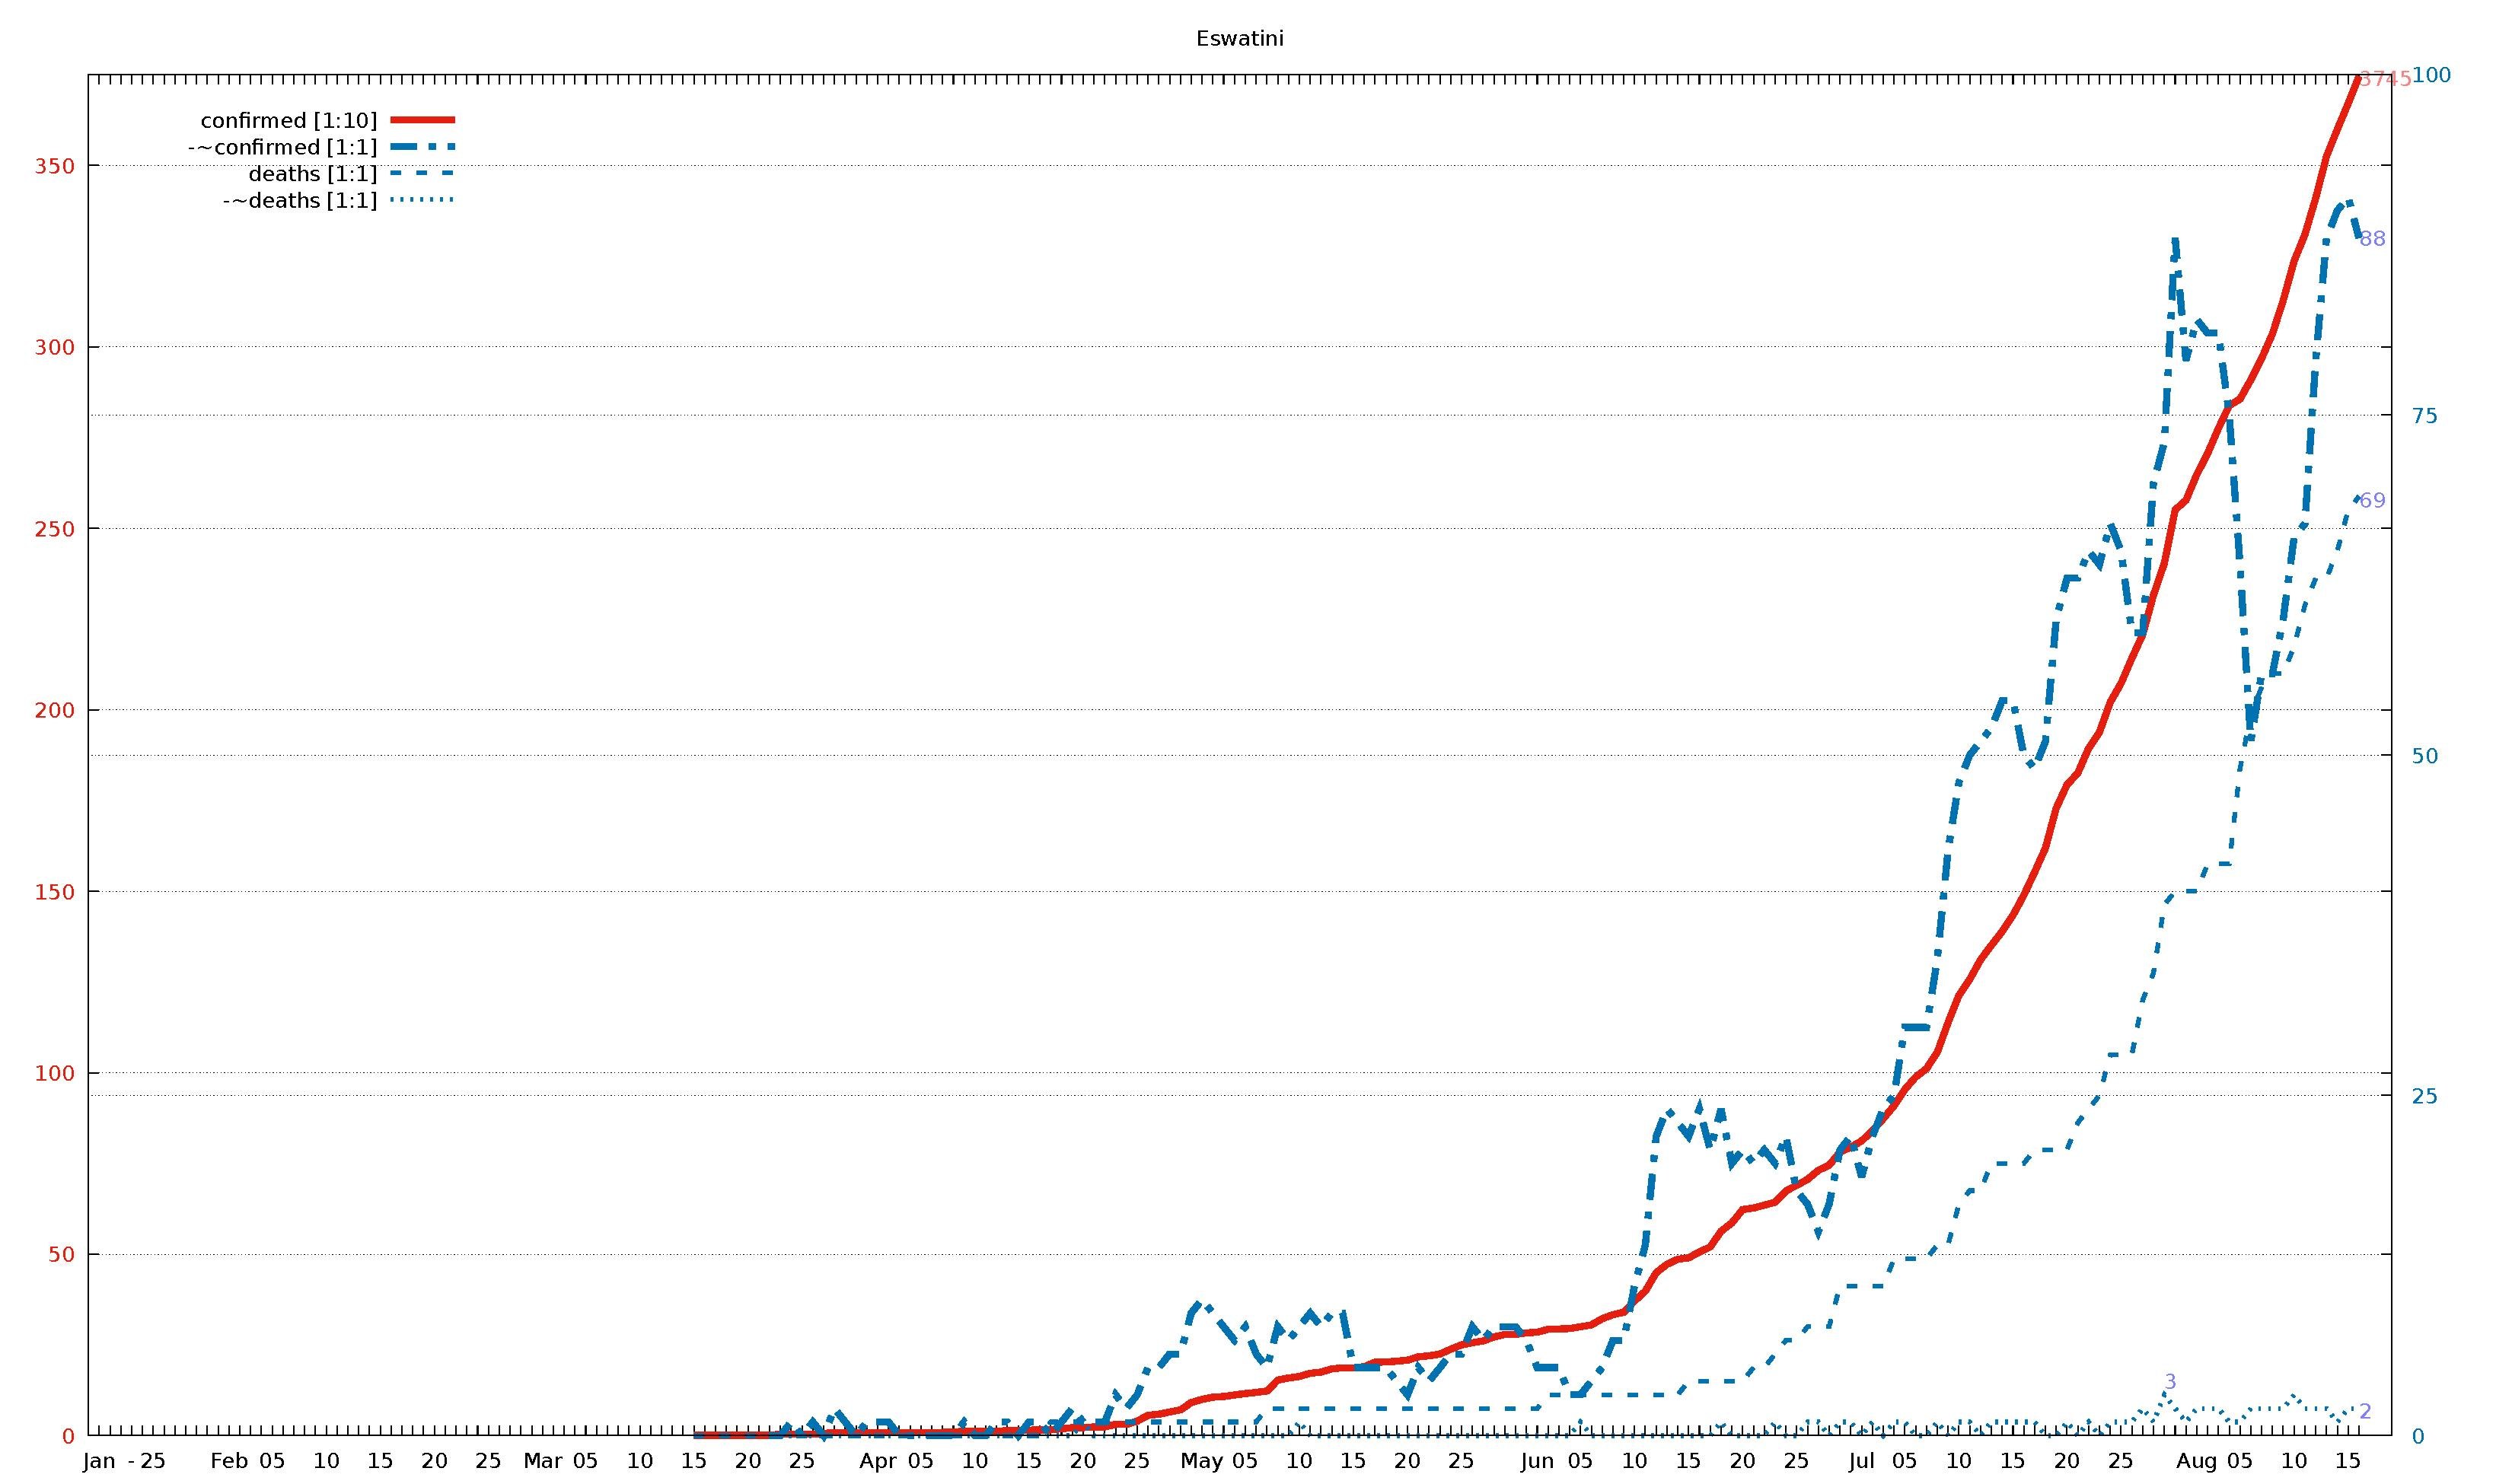
English: Diagram of WHO COVID-19 daily data (20 Jan - 16 Aug 2020) for "Total Confirmed Cases" (thick solid line), its smoothed increment (thick dash-dotted line), "Total Deaths" (thin dashed line) , and its smoothed increment (thin dotted line). Figures are taken from the available situation reports. Red and blue lines refer to the left and right vertical axis, respectively; the scaling factor for each curve is given in the legend. The horizontal axis starts on 20 Jan 2020 (situation report 1), and ends on 16 Aug 2020 (situation report 209). In the smoothed curves, for each day, 1/7 of the difference of the current day's figure and the figure a week ago is shown. For example, in situation report 115 (14 May 2020) and 121 (21 May 2020), there were 8676 and 5339 Total Confirmed Cases in Afghanistan, respectively, so the thick dash-dotted line passes through 477 = (8676-5339)/7 on 21 May.
For an overview of all related visualizations, and a more detailled description, see WHO Covid diagram set#Available country diagrams Jan-Aug 2020 (daily). |
| Date | |
| Source | Own work |
| Author | Jochen Burghardt |
Licensing
[edit]I, the copyright holder of this work, hereby publish it under the following license:
This file is licensed under the Creative Commons Attribution-Share Alike 4.0 International license.
- You are free:
- to share – to copy, distribute and transmit the work
- to remix – to adapt the work
- Under the following conditions:
- attribution – You must give appropriate credit, provide a link to the license, and indicate if changes were made. You may do so in any reasonable manner, but not in any way that suggests the licensor endorses you or your use.
- share alike – If you remix, transform, or build upon the material, you must distribute your contributions under the same or compatible license as the original.
Gnuplot source code
[edit]| Gnuplot source code |
|---|
set term pdf size 22,13
set term pdf font "sans,20"
set output "WHO_Covid_C_Eswatini.pdf"
set key autotitle columnhead
set termoption noenhanced
# (1) norm: 375 001 001 001

set xrange [-1:212]
set yrange [0:375]
set y2range [0:100]
set xtics 3650,100
set ytics 50 textcolor "#e51e10"
set y2tics 25 textcolor "#0072b2"
set grid y y2

set title "Eswatini"

$data <<EOF
rep day "confirmed [1:10]" "-~confirmed [1:1]" "deaths [1:1]" "-~deaths [1:1]"
1	Jan	.	-	.	-
2	""	.	-	.	-
3	""	.	-	.	-
-	-	-	-	-	-
4	""	.	-	.	-
5	25	.	-	.	-
6	""	.	-	.	-
7	""	.	-	.	-
8	""	.	-	.	-
9	""	.	-	.	-
10	""	.	-	.	-
11	""	.	-	.	-
12	Feb	.	-	.	-
13	""	.	-	.	-
14	""	.	-	.	-
15	""	.	-	.	-
16	05	.	-	.	-
17	""	.	-	.	-
18	""	.	-	.	-
19	""	.	-	.	-
20	""	.	-	.	-
21	10	.	-	.	-
22	""	.	-	.	-
23	""	.	-	.	-
24	""	.	-	.	-
25	""	.	-	.	-
26	15	.	-	.	-
27	""	.	-	.	-
28	""	.	-	.	-
29	""	.	-	.	-
30	""	.	-	.	-
31	20	.	-	.	-
32	""	.	-	.	-
33	""	.	-	.	-
34	""	.	-	.	-
35	""	.	-	.	-
36	25	.	-	.	-
37	""	.	-	.	-
38	""	.	-	.	-
39	""	.	-	.	-
40	""	.	-	.	-
41	Mar	.	-	.	-
42	""	.	-	.	-
43	""	.	-	.	-
44	""	.	-	.	-
45	05	.	-	.	-
46	""	.	-	.	-
47	""	.	-	.	-
48	""	.	-	.	-
49	""	.	-	.	-
50	10	.	-	.	-
51	""	.	-	.	-
52	""	.	-	.	-
53	""	.	-	.	-
54	""	.	-	.	-
55	15	1	-	0	-
56	""	1	-	0	-
57	""	1	-	0	-
58	""	1	-	0	-
59	""	1	-	0	-
60	20	1	-	0	-
61	""	1	-	0	-
62	""	1	0	0	0
63	""	4	0	0	0
64	""	4	1	0	0
65	25	4	0	0	0
66	""	4	1	0	0
67	""	6	0	0	0
68	""	9	2	0	0
69	""	9	1	0	0
70	""	9	0	0	0
71	""	9	1	0	0
72	Apr	9	1	0	0
73	""	9	1	0	0
74	""	9	0	0	0
75	""	9	0	0	0
76	05	9	0	0	0
77	""	9	0	0	0
78	""	9	0	0	0
79	""	10	0	0	0
80	""	12	1	0	0
81	10	12	0	0	0
82	""	12	0	0	0
83	""	12	1	0	0
84	""	14	1	0	0
85	""	14	0	0	0
86	15	15	1	0	0
87	""	16	1	0	0
88	""	16	0	1	0
89	""	19	1	1	0
90	""	22	2	1	0
91	20	22	1	1	1
92	""	24	1	1	0
93	""	24	1	1	0
94	""	31	3	1	0
95	""	31	2	1	0
96	25	40	3	1	0
97	""	56	5	1	0
98	""	59	5	1	0
99	""	65	6	1	0
100	""	71	6	1	0
101	""	91	9	1	0
102	May	100	10	1	0
103	""	106	9	1	0
104	""	108	8	1	0
105	""	112	7	1	0
106	05	116	8	1	0
107	""	119	6	1	0
108	""	123	5	2	0
109	""	153	8	2	0
110	""	159	7	2	0
111	10	163	8	2	1
112	""	172	9	2	0
113	""	175	8	2	0
114	""	184	9	2	0
115	""	187	9	2	0
116	15	187	5	2	0
117	""	190	5	2	0
118	""	202	5	2	0
119	""	203	5	2	0
120	""	205	4	2	0
121	20	208	3	2	0
122	""	217	5	2	0
123	""	220	4	2	0
124	""	225	5	2	0
125	""	238	6	2	0
126	25	250	6	2	0
127	""	256	8	2	0
128	""	261	7	2	0
129	""	272	8	2	0
130	""	279	8	2	0
131	""	279	8	2	0
132	""	283	7	2	0
133	Jun	285	5	2	0
134	""	293	5	3	0
135	""	294	5	3	0
136	""	295	3	3	0
137	05	300	3	3	1
138	""	305	4	3	0
139	""	322	5	3	0
140	""	333	7	3	0
141	""	340	7	3	0
142	10	371	11	3	0
143	""	398	14	3	0
144	""	449	22	3	0
145	""	472	24	3	0
146	""	486	23	3	0
147	15	490	22	4	0
148	""	506	24	4	0
149	""	520	21	4	0
150	""	563	24	4	1
151	""	586	20	4	0
152	20	623	21	4	0
153	""	627	20	5	0
154	""	635	21	5	0
155	""	643	20	6	1
156	""	674	22	7	0
157	25	690	18	7	0
158	""	706	17	8	1
159	""	731	15	8	1
160	""	745	17	8	0
161	""	781	21	11	1
162	""	795	22	11	1
163	Jul	812	19	11	0
164	""	840	22	11	1
165	""	873	24	11	0
166	""	909	25	13	1
167	05	954	30	13	1
168	""	988	30	13	0
169	""	1011	30	13	0
170	""	1056	35	14	1
171	""	1138	43	14	0
172	10	1213	48	17	1
173	""	1257	50	18	1
174	""	1311	51	18	0
175	""	1351	52	20	1
176	""	1389	54	20	1
177	15	1434	54	20	1
178	""	1489	50	20	1
179	""	1552	49	21	1
180	""	1619	51	21	0
181	""	1729	60	21	0
182	20	1793	63	21	1
183	""	1826	63	23	0
184	""	1894	65	24	1
185	""	1938	64	25	0
186	""	2021	67	28	1
187	25	2073	65	28	1
188	""	2142	59	28	1
189	""	2207	59	32	2
190	""	2316	70	34	1
191	""	2404	73	39	3
192	""	2551	88	40	2
193	""	2577	79	40	1
194	Aug	2648	82	40	2
195	""	2706	81	42	2
196	""	2775	81	42	2
197	""	2838	75	42	1
198	05	2856	64	49	1
199	""	2909	51	53	2
200	""	2968	56	55	2
201	""	3036	56	56	2
202	""	3128	60	56	2
203	10	3236	66	58	3
204	""	3309	67	61	2
205	""	3410	79	63	2
206	""	3525	88	63	2
207	""	3599	90	65	1
208	15	3670	91	68	2
209	""	3745	88	69	2
EOF

# confirmed:
set label "3745   " at first 209,374           left back textcolor "#ff8080"
# -~confirmed:
set label "88     " at first 209, 88*375/100   left back textcolor "#8080ff"
# deaths:
set label "69     " at first 209, 69*375/100   left back textcolor "#8080ff"
# -~deaths:
set label "2      " at first 209,  2*375/100   left back textcolor "#8080ff"
set label "3      " at first 191,  3*375/100+4 left back textcolor "#8080ff"

set multiplot
  plot $data using 0:($3/     10        ) with lines lc 7 lw 8 dt 1 title at 0.150, 0.920
replot $data using 0:($4/      1*375/100) with lines lc 6 lw 8 dt 4 title at 0.150, 0.902
replot $data using 0:($5/      1*375/100) with lines lc 6 lw 5 dt 2 title at 0.150, 0.884
replot $data using 0:($6/      1*375/100) with lines lc 6 lw 5 dt 3 title at 0.150, 0.866

# plot hor axis calendar
replot $data using 0:(0):xticlabel(2) with lines
|
File history
Click on a date/time to view the file as it appeared at that time.
| Date/Time | Thumbnail | Dimensions | User | Comment | |
|---|---|---|---|---|---|
| current | 19:03, 24 September 2020 |  | 3,300 × 1,950 (22 KB) | Jochen Burghardt (talk | contribs) | =={{int:filedesc}}== {{Information |description={{en|1=Diagram of WHO COVID-19 daily data (20 Jan - 16 Aug 2020) for ''"Total Confirmed Cases"'' (thick solid line), its smoothed increment (thick dash-dotted line), ''"Total Deaths"'' (thin dashed line), and its smoothed increment (thin dotted line); see File:WHO_Covid_2020_Jan-Aug_daily_C_Afghanistan.pdf for details.}} |date=2020-09-24 |source={{own}} |author=Jochen Burghardt |permission= |other_versions=[[:File:... |
You cannot overwrite this file.
File usage on Commons
There are no pages that use this file.