File:WHO Covid 2020 Jan-Aug daily C Cote dIvoire.pdf
Jump to navigation
Jump to search

Size of this JPG preview of this PDF file: 800 × 473 pixels. Other resolutions: 320 × 189 pixels | 640 × 378 pixels | 1,024 × 605 pixels | 1,280 × 756 pixels | 3,300 × 1,950 pixels.
Original file (3,300 × 1,950 pixels, file size: 23 KB, MIME type: application/pdf)
Captions
Captions
Add a one-line explanation of what this file represents
Summary
[edit]| Description |
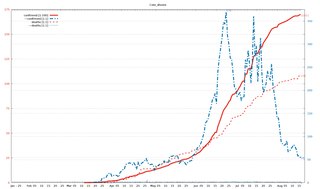
English: Diagram of WHO COVID-19 daily data (20 Jan - 16 Aug 2020) for "Total Confirmed Cases" (thick solid line), its smoothed increment (thick dash-dotted line), "Total Deaths" (thin dashed line) , and its smoothed increment (thin dotted line). Figures are taken from the available situation reports. Red and blue lines refer to the left and right vertical axis, respectively; the scaling factor for each curve is given in the legend. The horizontal axis starts on 20 Jan 2020 (situation report 1), and ends on 16 Aug 2020 (situation report 209). In the smoothed curves, for each day, 1/7 of the difference of the current day's figure and the figure a week ago is shown. For example, in situation report 115 (14 May 2020) and 121 (21 May 2020), there were 8676 and 5339 Total Confirmed Cases in Afghanistan, respectively, so the thick dash-dotted line passes through 477 = (8676-5339)/7 on 21 May.
For an overview of all related visualizations, and a more detailled description, see WHO Covid diagram set#Available country diagrams Jan-Aug 2020 (daily). |
| Date | |
| Source | Own work |
| Author | Jochen Burghardt |
Licensing
[edit]I, the copyright holder of this work, hereby publish it under the following license:
This file is licensed under the Creative Commons Attribution-Share Alike 4.0 International license.
- You are free:
- to share – to copy, distribute and transmit the work
- to remix – to adapt the work
- Under the following conditions:
- attribution – You must give appropriate credit, provide a link to the license, and indicate if changes were made. You may do so in any reasonable manner, but not in any way that suggests the licensor endorses you or your use.
- share alike – If you remix, transform, or build upon the material, you must distribute your contributions under the same or compatible license as the original.
Gnuplot source code
[edit]| Gnuplot source code |
|---|
set term pdf size 22,13
set term pdf font "sans,20"
set output "WHO_Covid_C_Cote_dIvoire.pdf"
set key autotitle columnhead
set termoption noenhanced
# (1) norm: 170 370 108 001
# (2) dist: 1,0:218 2,0:158 2,1:291
# (3,4) dist max: 291 2:108--1:370
# (4) right: 0 1 0 1
# (6,7) scMax: 175 375
# (8) scale: [1:100] [1:1] [1:1] [1:1]


set xrange [-1:212]
set yrange [0:175]
set y2range [0:375]
set xtics 3650,100
set ytics 25 textcolor "#e51e10"
set y2tics 50 textcolor "#0072b2"
set grid y y2

set title "Cote_dIvoire"

$data <<EOF
rep day "confirmed [1:100]" "-~confirmed [1:1]" "deaths [1:1]" "-~deaths [1:1]"
1	Jan	.	-	.	-
2	""	.	-	.	-
3	""	.	-	.	-
-	-	-	-	-	-
4	""	.	-	.	-
5	25	.	-	.	-
6	""	.	-	.	-
7	""	.	-	.	-
8	""	.	-	.	-
9	""	.	-	.	-
10	""	.	-	.	-
11	""	.	-	.	-
12	Feb	.	-	.	-
13	""	.	-	.	-
14	""	.	-	.	-
15	""	.	-	.	-
16	05	.	-	.	-
17	""	.	-	.	-
18	""	.	-	.	-
19	""	.	-	.	-
20	""	.	-	.	-
21	10	.	-	.	-
22	""	.	-	.	-
23	""	.	-	.	-
24	""	.	-	.	-
25	""	.	-	.	-
26	15	.	-	.	-
27	""	.	-	.	-
28	""	.	-	.	-
29	""	.	-	.	-
30	""	.	-	.	-
31	20	.	-	.	-
32	""	.	-	.	-
33	""	.	-	.	-
34	""	.	-	.	-
35	""	.	-	.	-
36	25	.	-	.	-
37	""	.	-	.	-
38	""	.	-	.	-
39	""	.	-	.	-
40	""	.	-	.	-
41	Mar	.	-	.	-
42	""	.	-	.	-
43	""	.	-	.	-
44	""	.	-	.	-
45	05	.	-	.	-
46	""	.	-	.	-
47	""	.	-	.	-
48	""	.	-	.	-
49	""	.	-	.	-
50	10	.	-	.	-
51	""	.	-	.	-
52	""	1	-	0	-
53	""	1	-	0	-
54	""	1	-	0	-
55	15	3	-	0	-
56	""	3	-	0	-
57	""	6	-	0	-
58	""	6	-	0	-
59	""	9	1	0	0
60	20	9	1	0	0
61	""	9	1	0	0
62	""	9	1	0	0
63	""	25	3	0	0
64	""	25	3	0	0
65	25	72	10	0	0
66	""	80	10	0	0
67	""	80	10	0	0
68	""	92	12	0	0
69	""	140	18	0	0
70	""	165	20	0	0
71	""	169	21	0	0
72	Apr	169	14	0	0
73	""	190	16	0	0
74	""	190	15	1	0
75	""	203	16	1	0
76	05	245	15	2	1
77	""	245	12	2	0
78	""	323	22	3	0
79	""	349	25	3	1
80	""	384	28	3	0
81	10	384	28	3	0
82	""	480	39	3	1
83	""	533	41	4	0
84	""	533	42	4	0
85	""	626	43	6	1
86	15	638	41	6	0
87	""	654	39	6	1
88	""	688	43	6	0
89	""	742	38	6	0
90	""	742	29	6	1
91	20	847	45	9	0
92	""	879	36	10	1
93	""	916	40	13	1
94	""	952	43	14	1
95	""	1004	45	14	1
96	25	1077	48	14	1
97	""	1111	52	14	2
98	""	1150	44	14	0
99	""	1164	40	14	1
100	""	1183	39	14	0
101	""	1238	40	14	0
102	May	1275	39	14	0
103	""	1275	28	14	0
104	""	1362	36	15	0
105	""	1398	36	17	1
106	05	1432	38	17	0
107	""	1464	40	18	1
108	""	1516	40	18	0
109	""	1571	42	20	1
110	""	1602	47	20	1
111	10	1667	43	21	1
112	""	1700	44	21	0
113	""	1730	42	21	1
114	""	1857	56	21	0
115	""	1912	57	24	1
116	15	1971	57	24	1
117	""	2017	59	24	0
118	""	2061	57	25	1
119	""	2109	58	27	1
120	""	2119	56	28	1
121	20	2153	42	28	1
122	""	2231	45	29	0
123	""	2301	48	29	1
124	""	2341	46	29	1
125	""	2366	43	30	1
126	25	2376	39	30	0
127	""	2423	43	30	0
128	""	2477	46	30	1
129	""	2556	47	31	0
130	""	2641	48	32	0
131	""	2750	59	32	1
132	""	2799	62	33	0
133	Jun	2833	65	33	1
134	""	2951	75	33	0
135	""	3024	78	33	0
136	""	3110	80	35	1
137	05	3262	88	35	0
138	""	3431	98	36	1
139	""	3557	108	36	0
140	""	3739	129	36	1
141	""	3881	133	38	1
142	10	3995	139	38	0
143	""	4181	153	41	1
144	""	4404	163	41	1
145	""	4684	179	45	1
146	""	4848	184	45	2
147	15	5084	193	45	1
148	""	5084	171	45	1
149	""	5679	241	46	1
150	""	6063	269	48	1
151	""	6444	291	49	1
152	20	6874	313	49	1
153	""	7276	347	52	1
154	""	7492	344	54	1
155	""	7677	370	56	2
156	""	7904	318	58	1
157	25	8164	300	58	2
158	""	8334	270	60	1
159	""	8739	267	64	2
160	""	8944	238	66	2
161	""	8944	208	66	2
162	""	9101	203	66	2
163	Jul	9214	187	66	1
164	""	9499	191	68	1
165	""	9702	195	68	1
166	""	9992	179	68	1
167	05	10244	186	70	0
168	""	10244	186	70	1
169	""	10966	266	75	1
170	""	10966	250	75	2
171	""	11504	287	78	1
172	10	11504	257	78	1
173	""	11504	216	78	2
174	""	12052	259	81	1
175	""	12766	360	84	2
176	""	12872	272	84	2
177	15	13037	296	87	1
178	""	13037	219	87	2
179	""	13403	271	87	1
180	""	13696	313	87	1
181	""	13696	235	87	1
182	20	14119	194	92	1
183	""	14312	205	92	1
184	""	14531	214	93	1
185	""	14733	242	93	1
186	""	15001	228	93	1
187	25	15253	223	94	1
188	""	15494	257	94	1
189	""	15596	211	96	1
190	""	15655	191	96	0
191	""	15713	169	98	1
192	""	15713	140	98	1
193	""	15978	140	100	1
194	Aug	16047	113	102	1
195	""	16109	88	102	1
196	""	16182	84	102	1
197	""	16220	81	102	1
198	05	16293	82	103	0
199	""	16349	91	103	1
200	""	16447	67	103	0
201	""	16524	68	104	1
202	""	16620	73	104	0
203	10	16715	77	105	0
204	""	16798	82	105	1
205	""	16847	79	105	0
206	""	16847	71	105	0
207	""	16847	58	105	1
208	15	16935	58	108	0
209	""	16993	54	108	1
EOF

# confirmed:
set label "16993  " at first 209,169           left back textcolor "#ff8080"
# -~confirmed:
set label "54     " at first 209, 54*175/375   left back textcolor "#8080ff"
set label "370    " at first 155,370*175/375+2 left back textcolor "#8080ff"
# deaths:
set label "108    " at first 209,108           left back textcolor "#ff8080"
# -~deaths:
set label "1      " at first 209,  1*175/375   left back textcolor "#8080ff"
set label "2      " at first  97,  2*175/375+2 left back textcolor "#8080ff"

set multiplot
  plot $data using 0:($3/    100        ) with lines lc 7 lw 8 dt 1 title at 0.150, 0.920
replot $data using 0:($4/      1*175/375) with lines lc 6 lw 8 dt 4 title at 0.150, 0.902
replot $data using 0:($5/      1        ) with lines lc 7 lw 5 dt 2 title at 0.150, 0.884
replot $data using 0:($6/      1*175/375) with lines lc 6 lw 5 dt 3 title at 0.150, 0.866

# plot hor axis calendar
replot $data using 0:(0):xticlabel(2) with lines
|
File history
Click on a date/time to view the file as it appeared at that time.
| Date/Time | Thumbnail | Dimensions | User | Comment | |
|---|---|---|---|---|---|
| current | 18:58, 24 September 2020 |  | 3,300 × 1,950 (23 KB) | Jochen Burghardt (talk | contribs) | =={{int:filedesc}}== {{Information |description={{en|1=Diagram of WHO COVID-19 daily data (20 Jan - 16 Aug 2020) for ''"Total Confirmed Cases"'' (thick solid line), its smoothed increment (thick dash-dotted line), ''"Total Deaths"'' (thin dashed line), and its smoothed increment (thin dotted line); see File:WHO_Covid_2020_Jan-Aug_daily_C_Afghanistan.pdf for details.}} |date=2020-09-24 |source={{own}} |author=Jochen Burghardt |permission= |other_versions=[[:File:... |
You cannot overwrite this file.
File usage on Commons
There are no pages that use this file.