File:WHO Covid 2020 Jan-Aug daily C Benin.pdf
Jump to navigation
Jump to search

Size of this JPG preview of this PDF file: 800 × 473 pixels. Other resolutions: 320 × 189 pixels | 640 × 378 pixels | 1,024 × 605 pixels | 1,280 × 756 pixels | 3,300 × 1,950 pixels.
Original file (3,300 × 1,950 pixels, file size: 21 KB, MIME type: application/pdf)
Captions
Captions
Add a one-line explanation of what this file represents
Summary
[edit]| Description |
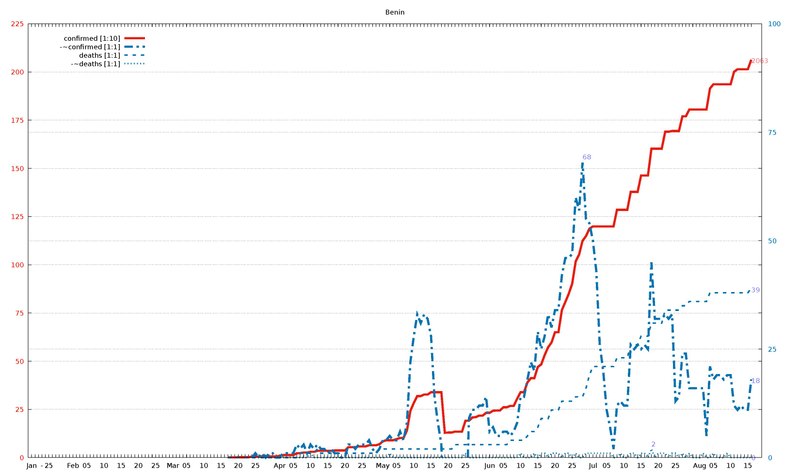
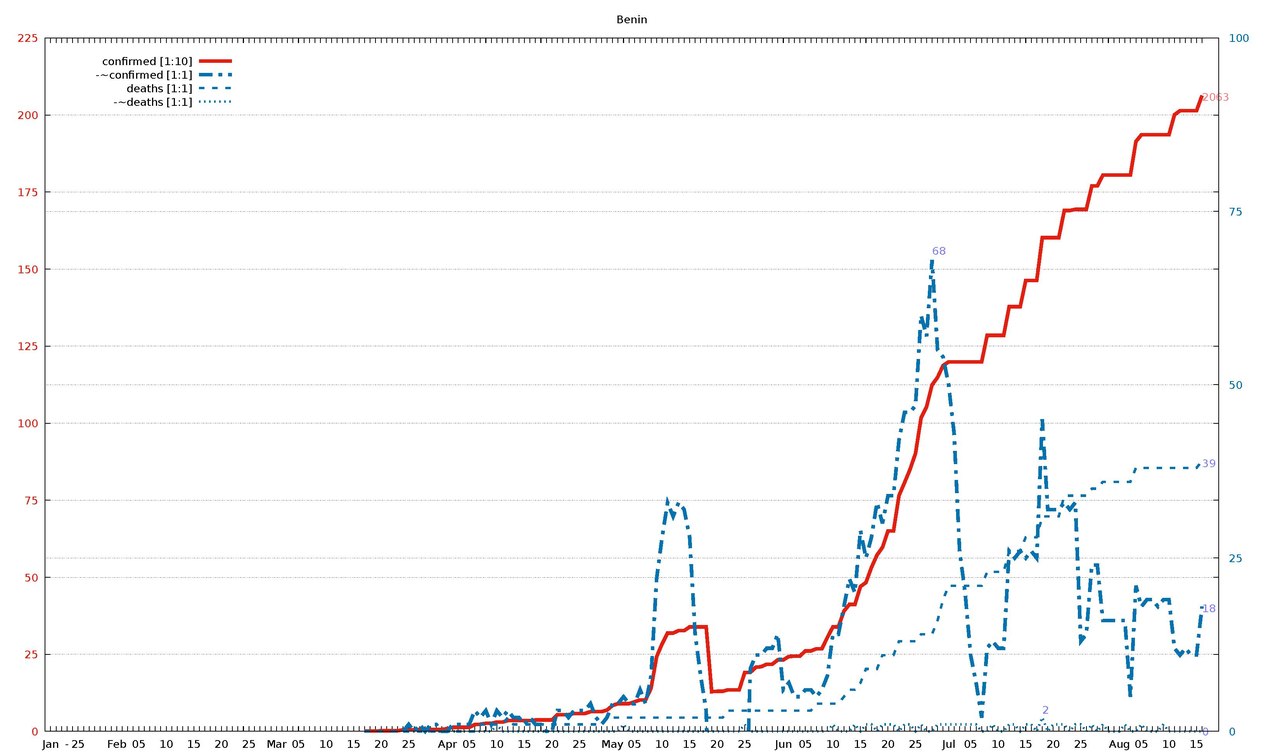
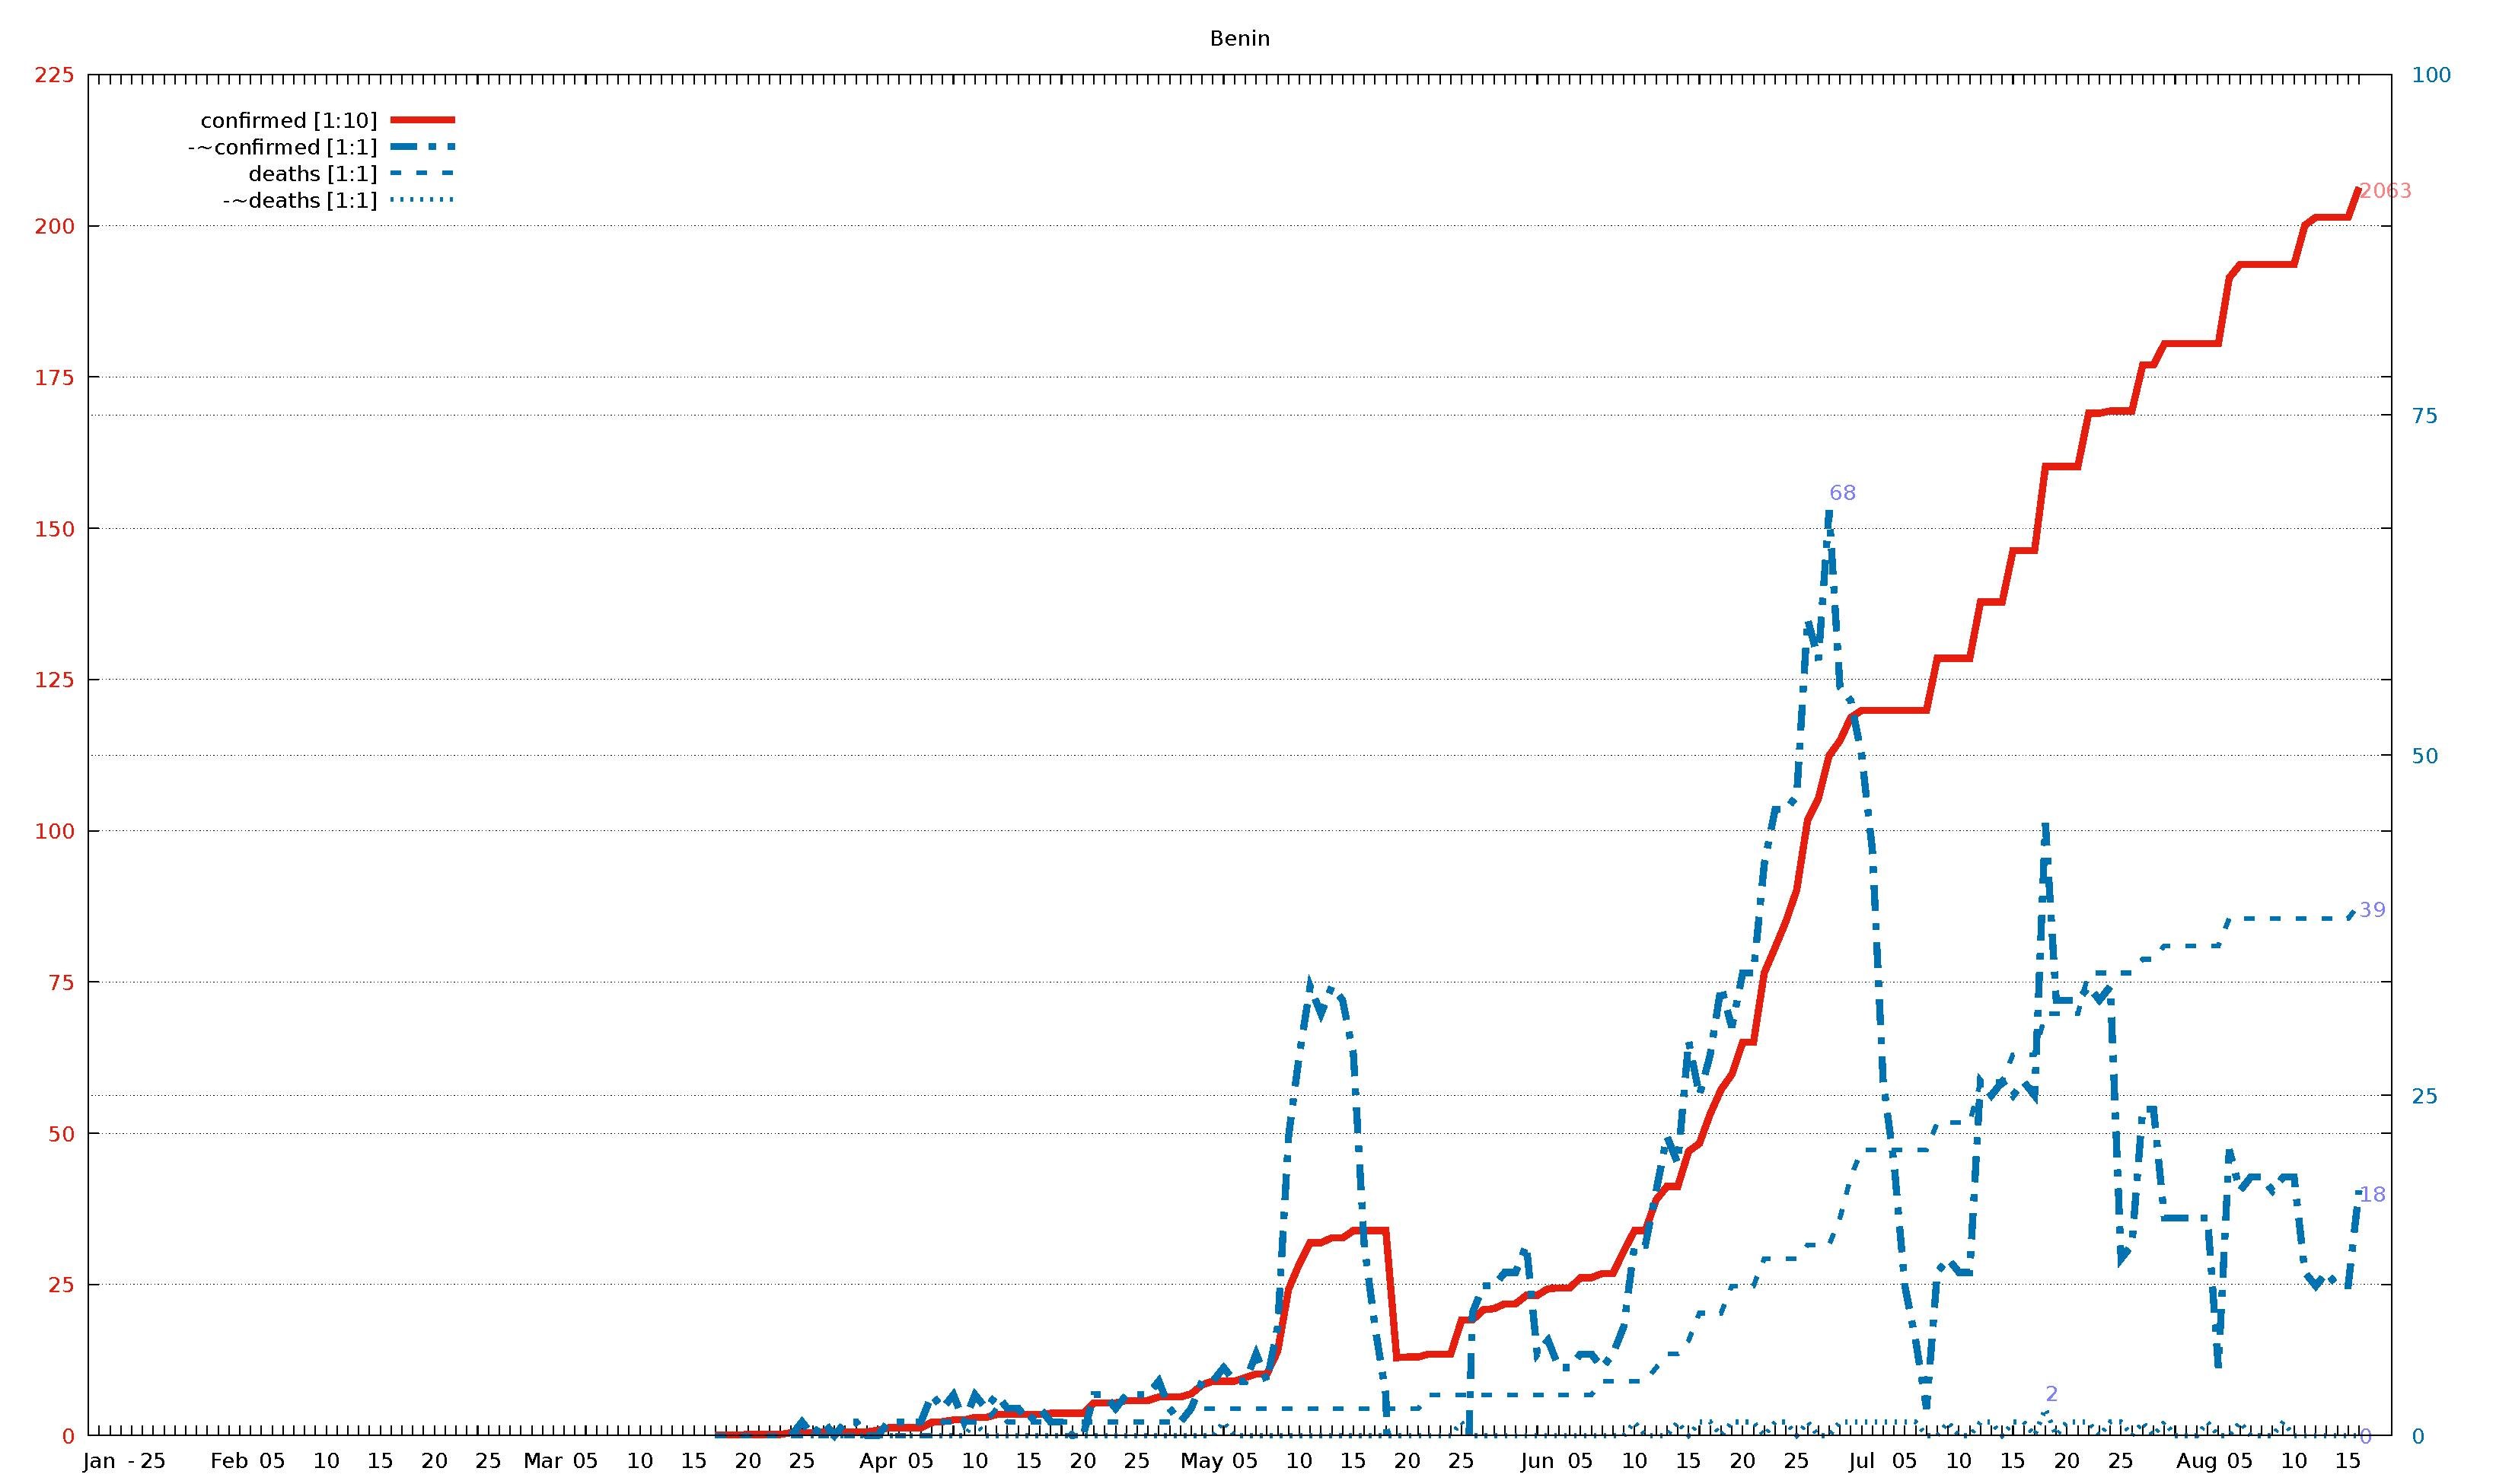
English: Diagram of WHO COVID-19 daily data (20 Jan - 16 Aug 2020) for "Total Confirmed Cases" (thick solid line), its smoothed increment (thick dash-dotted line), "Total Deaths" (thin dashed line) , and its smoothed increment (thin dotted line). Figures are taken from the available situation reports. Red and blue lines refer to the left and right vertical axis, respectively; the scaling factor for each curve is given in the legend. The horizontal axis starts on 20 Jan 2020 (situation report 1), and ends on 16 Aug 2020 (situation report 209). In the smoothed curves, for each day, 1/7 of the difference of the current day's figure and the figure a week ago is shown. For example, in situation report 115 (14 May 2020) and 121 (21 May 2020), there were 8676 and 5339 Total Confirmed Cases in Afghanistan, respectively, so the thick dash-dotted line passes through 477 = (8676-5339)/7 on 21 May.
For an overview of all related visualizations, and a more detailled description, see WHO Covid diagram set#Available country diagrams Jan-Aug 2020 (daily). |
| Date | |
| Source | Own work |
| Author | Jochen Burghardt |
Licensing
[edit]I, the copyright holder of this work, hereby publish it under the following license:
This file is licensed under the Creative Commons Attribution-Share Alike 4.0 International license.
- You are free:
- to share – to copy, distribute and transmit the work
- to remix – to adapt the work
- Under the following conditions:
- attribution – You must give appropriate credit, provide a link to the license, and indicate if changes were made. You may do so in any reasonable manner, but not in any way that suggests the licensor endorses you or your use.
- share alike – If you remix, transform, or build upon the material, you must distribute your contributions under the same or compatible license as the original.
Gnuplot source code
[edit]Gnuplot source code
|
|---|
set term pdf size 22,13
set term pdf font "sans,20"
set output "WHO_Covid_C_Benin.pdf"
set key autotitle columnhead
set termoption noenhanced
# (1) norm: 207 001 001 001

set xrange [-1:212]
set yrange [0:225]
set y2range [0:100]
set xtics 3650,100
set ytics 25 textcolor "#e51e10"
set y2tics 25 textcolor "#0072b2"
set grid y y2

set title "Benin"

$data <<EOF
rep day "confirmed [1:10]" "-~confirmed [1:1]" "deaths [1:1]" "-~deaths [1:1]"
1	Jan	.	-	.	-
2	""	.	-	.	-
3	""	.	-	.	-
-	-	-	-	-	-
4	""	.	-	.	-
5	25	.	-	.	-
6	""	.	-	.	-
7	""	.	-	.	-
8	""	.	-	.	-
9	""	.	-	.	-
10	""	.	-	.	-
11	""	.	-	.	-
12	Feb	.	-	.	-
13	""	.	-	.	-
14	""	.	-	.	-
15	""	.	-	.	-
16	05	.	-	.	-
17	""	.	-	.	-
18	""	.	-	.	-
19	""	.	-	.	-
20	""	.	-	.	-
21	10	.	-	.	-
22	""	.	-	.	-
23	""	.	-	.	-
24	""	.	-	.	-
25	""	.	-	.	-
26	15	.	-	.	-
27	""	.	-	.	-
28	""	.	-	.	-
29	""	.	-	.	-
30	""	.	-	.	-
31	20	.	-	.	-
32	""	.	-	.	-
33	""	.	-	.	-
34	""	.	-	.	-
35	""	.	-	.	-
36	25	.	-	.	-
37	""	.	-	.	-
38	""	.	-	.	-
39	""	.	-	.	-
40	""	.	-	.	-
41	Mar	.	-	.	-
42	""	.	-	.	-
43	""	.	-	.	-
44	""	.	-	.	-
45	05	.	-	.	-
46	""	.	-	.	-
47	""	.	-	.	-
48	""	.	-	.	-
49	""	.	-	.	-
50	10	.	-	.	-
51	""	.	-	.	-
52	""	.	-	.	-
53	""	.	-	.	-
54	""	.	-	.	-
55	15	.	-	.	-
56	""	.	-	.	-
57	""	1	-	0	-
58	""	1	-	0	-
59	""	1	-	0	-
60	20	2	-	0	-
61	""	2	-	0	-
62	""	2	-	0	-
63	""	2	-	0	-
64	""	5	0	0	0
65	25	5	1	0	0
66	""	5	0	0	0
67	""	6	1	0	0
68	""	6	0	0	0
69	""	6	1	0	0
70	""	6	1	0	0
71	""	6	0	0	0
72	Apr	9	0	0	0
73	""	13	1	0	0
74	""	13	1	0	0
75	""	13	1	0	0
76	05	13	1	0	0
77	""	22	3	0	0
78	""	23	2	1	0
79	""	26	3	1	0
80	""	26	1	1	0
81	10	30	3	1	1
82	""	30	2	1	0
83	""	35	3	2	0
84	""	35	2	1	0
85	""	35	2	1	0
86	15	35	1	1	0
87	""	35	2	1	0
88	""	37	1	1	0
89	""	37	1	1	0
90	""	37	0	1	0
91	20	37	0	1	0
92	""	54	3	1	0
93	""	54	3	1	0
94	""	54	2	1	0
95	""	58	3	1	0
96	25	58	3	1	0
97	""	58	3	1	0
98	""	64	4	1	0
99	""	64	2	1	0
100	""	64	1	1	0
101	""	69	2	2	0
102	May	84	4	2	0
103	""	90	4	2	0
104	""	90	5	2	1
105	""	90	4	2	0
106	05	96	4	2	0
107	""	102	6	2	0
108	""	102	4	2	0
109	""	140	8	2	0
110	""	242	22	2	0
111	10	284	28	2	0
112	""	319	33	2	0
113	""	319	31	2	0
114	""	327	33	2	0
115	""	327	32	2	0
116	15	339	28	2	0
117	""	339	14	2	0
118	""	339	8	2	0
119	""	339	3	2	0
120	""	129	-27	2	0
121	20	130	-29	2	0
122	""	130	-28	2	0
123	""	135	-29	3	0
124	""	135	-29	3	0
125	""	135	-29	3	0
126	25	191	-21	3	1
127	""	191	9	3	0
128	""	208	11	3	0
129	""	210	11	3	0
130	""	218	12	3	0
131	""	218	12	3	0
132	""	232	14	3	0
133	Jun	232	6	3	0
134	""	243	7	3	0
135	""	244	5	3	0
136	""	244	5	3	0
137	05	261	6	3	0
138	""	261	6	3	0
139	""	268	5	4	0
140	""	268	6	4	0
141	""	305	8	4	0
142	10	339	14	4	1
143	""	339	14	4	0
144	""	390	18	5	0
145	""	412	22	6	0
146	""	412	20	6	1
147	15	470	29	7	0
148	""	483	25	9	1
149	""	532	28	9	1
150	""	572	33	9	0
151	""	597	30	11	1
152	20	650	34	11	1
153	""	650	34	11	1
154	""	765	42	13	0
155	""	807	46	13	1
156	""	850	46	13	1
157	25	902	47	13	0
158	""	1017	60	14	1
159	""	1053	57	14	0
160	""	1124	68	14	0
161	""	1149	55	16	1
162	""	1187	54	19	1
163	Jul	1199	50	21	1
164	""	1199	43	21	1
165	""	1199	26	21	1
166	""	1199	20	21	1
167	05	1199	11	21	1
168	""	1199	7	21	1
169	""	1199	2	21	0
170	""	1285	12	23	0
171	""	1285	13	23	1
172	10	1285	12	23	0
173	""	1285	12	23	0
174	""	1378	26	26	1
175	""	1378	25	26	1
176	""	1378	26	26	0
177	15	1463	25	28	1
178	""	1463	26	28	1
179	""	1463	25	28	0
180	""	1602	45	31	2
181	""	1602	32	31	0
182	20	1602	32	31	1
183	""	1602	32	31	1
184	""	1690	33	34	1
185	""	1690	32	34	0
186	""	1694	33	34	1
187	25	1694	13	34	1
188	""	1694	14	34	0
189	""	1770	24	35	1
190	""	1770	24	35	0
191	""	1805	16	36	1
192	""	1805	16	36	0
193	""	1805	16	36	0
194	Aug	1805	16	36	0
195	""	1805	16	36	1
196	""	1805	5	36	0
197	""	1914	21	38	0
198	05	1936	18	38	1
199	""	1936	19	38	0
200	""	1936	19	38	0
201	""	1936	18	38	0
202	""	1936	19	38	1
203	10	1936	19	38	0
204	""	2001	12	38	0
205	""	2014	11	38	0
206	""	2014	12	38	0
207	""	2014	11	38	0
208	15	2014	11	38	0
209	""	2063	18	39	0
EOF

# confirmed:
set label "2063   " at first 209,206           left back textcolor "#ff8080"
# -~confirmed:
set label "18     " at first 209, 18*225/100   left back textcolor "#8080ff"
set label "68     " at first 160, 68*225/100+3 left back textcolor "#8080ff"
# deaths:
set label "39     " at first 209, 39*225/100   left back textcolor "#8080ff"
# -~deaths:
set label "0      " at first 209,  0*225/100   left back textcolor "#8080ff"
set label "2      " at first 180,  2*225/100+3 left back textcolor "#8080ff"

set multiplot
  plot $data using 0:($3/     10        ) with lines lc 7 lw 8 dt 1 title at 0.150, 0.920
replot $data using 0:($4/      1*225/100) with lines lc 6 lw 8 dt 4 title at 0.150, 0.902
replot $data using 0:($5/      1*225/100) with lines lc 6 lw 5 dt 2 title at 0.150, 0.884
replot $data using 0:($6/      1*225/100) with lines lc 6 lw 5 dt 3 title at 0.150, 0.866

# plot hor axis calendar
replot $data using 0:(0):xticlabel(2) with lines
|
File history
Click on a date/time to view the file as it appeared at that time.
| Date/Time | Thumbnail | Dimensions | User | Comment | |
|---|---|---|---|---|---|
| current | 18:51, 24 September 2020 |  | 3,300 × 1,950 (21 KB) | Jochen Burghardt (talk | contribs) | =={{int:filedesc}}== {{Information |description={{en|1=Diagram of WHO COVID-19 daily data (20 Jan - 16 Aug 2020) for ''"Total Confirmed Cases"'' (thick solid line), its smoothed increment (thick dash-dotted line), ''"Total Deaths"'' (thin dashed line), and its smoothed increment (thin dotted line); see File:WHO_Covid_2020_Jan-Aug_daily_C_Afghanistan.pdf for details.}} |date=2020-09-24 |source={{own}} |author=Jochen Burghardt |permission= |other_versions=[[:File:... |
You cannot overwrite this file.
File usage on Commons
There are no pages that use this file.