File:United States GDP Inflation trend.png
Jump to navigation
Jump to search
Size of this preview: 800 × 491 pixels. Other resolutions: 320 × 196 pixels | 640 × 393 pixels | 979 × 601 pixels.
Original file (979 × 601 pixels, file size: 13 KB, MIME type: image/png)
Captions
Captions
Add a one-line explanation of what this file represents
| Description |
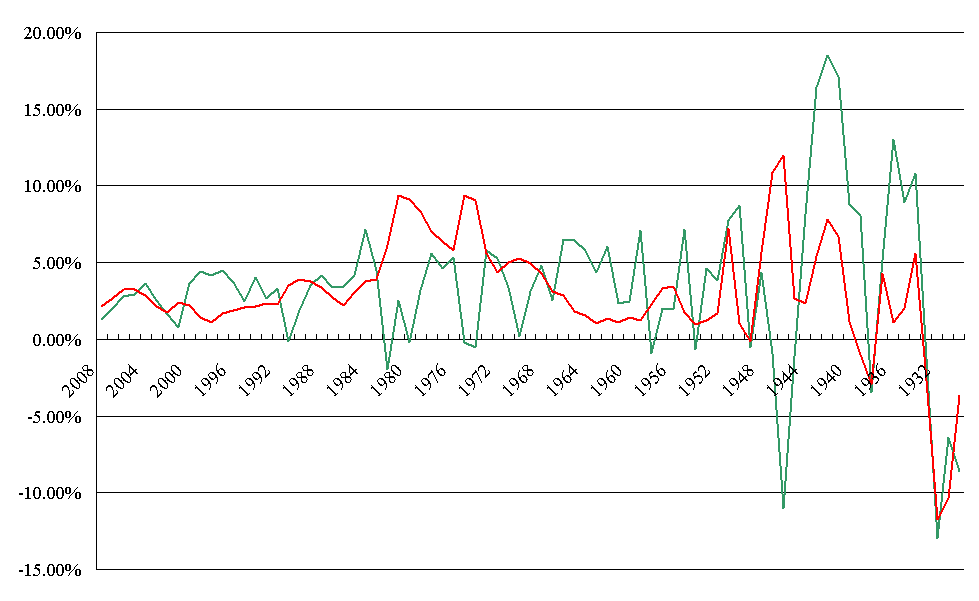
English: Real GDP (the green line) and Implicit GDP deflator changes (the red line) in United States. The original data released by Bureau of Economic Analysis on 01/30/2009 (on-line available at http://www.econstats.com/gdp/gdp__q1.csv)
Tiếng Việt: Tốc độ tăng trưởng kinh tế (tỷ lệ thay đổi GDP thực tế được thể hiện bằng đường màu lục) và tỷ lệ lạm phát (tỷ lệ thay đổi chỉ số giảm phát GDP được thể hiện bằng đường màu đỏ) ở Hoa Kỳ. Biểu đồ vẽ dựa trên số liệu của Cơ quan Phân tích Kinh tế (Hoa Kỳ) công bố ngày 30/1/2009 tại http://www.econstats.com/gdp/gdp__q1.csv |
||
| Date | |||
| Source | Own work | ||
| Author | Bình Giang | ||
| Permission (Reusing this file) |
|
File history
Click on a date/time to view the file as it appeared at that time.
| Date/Time | Thumbnail | Dimensions | User | Comment | |
|---|---|---|---|---|---|
| current | 08:12, 1 February 2009 | | 979 × 601 (13 KB) | Bình Giang (talk | contribs) | {{Information |Description={{en|1=Real GDP and Implicit GDP deflator changes in United States. The original data released by Bureau of Economic Analysis in 01/30/2009 (on-line available at http://www.econstats.com/gdp/gdp__q1.csv) }} {{vi|1=Tốc độ t� |
You cannot overwrite this file.
File usage on Commons
There are no pages that use this file.
File usage on other wikis
The following other wikis use this file:
- Usage on vi.wikipedia.org