File:Transcriptional, spatiotemporal and paracrine signatures of human pregranulosa cells.jpg
Original file (2,118 × 1,595 pixels, file size: 1.91 MB, MIME type: image/jpeg)
Captions
Captions
Summary
[edit]
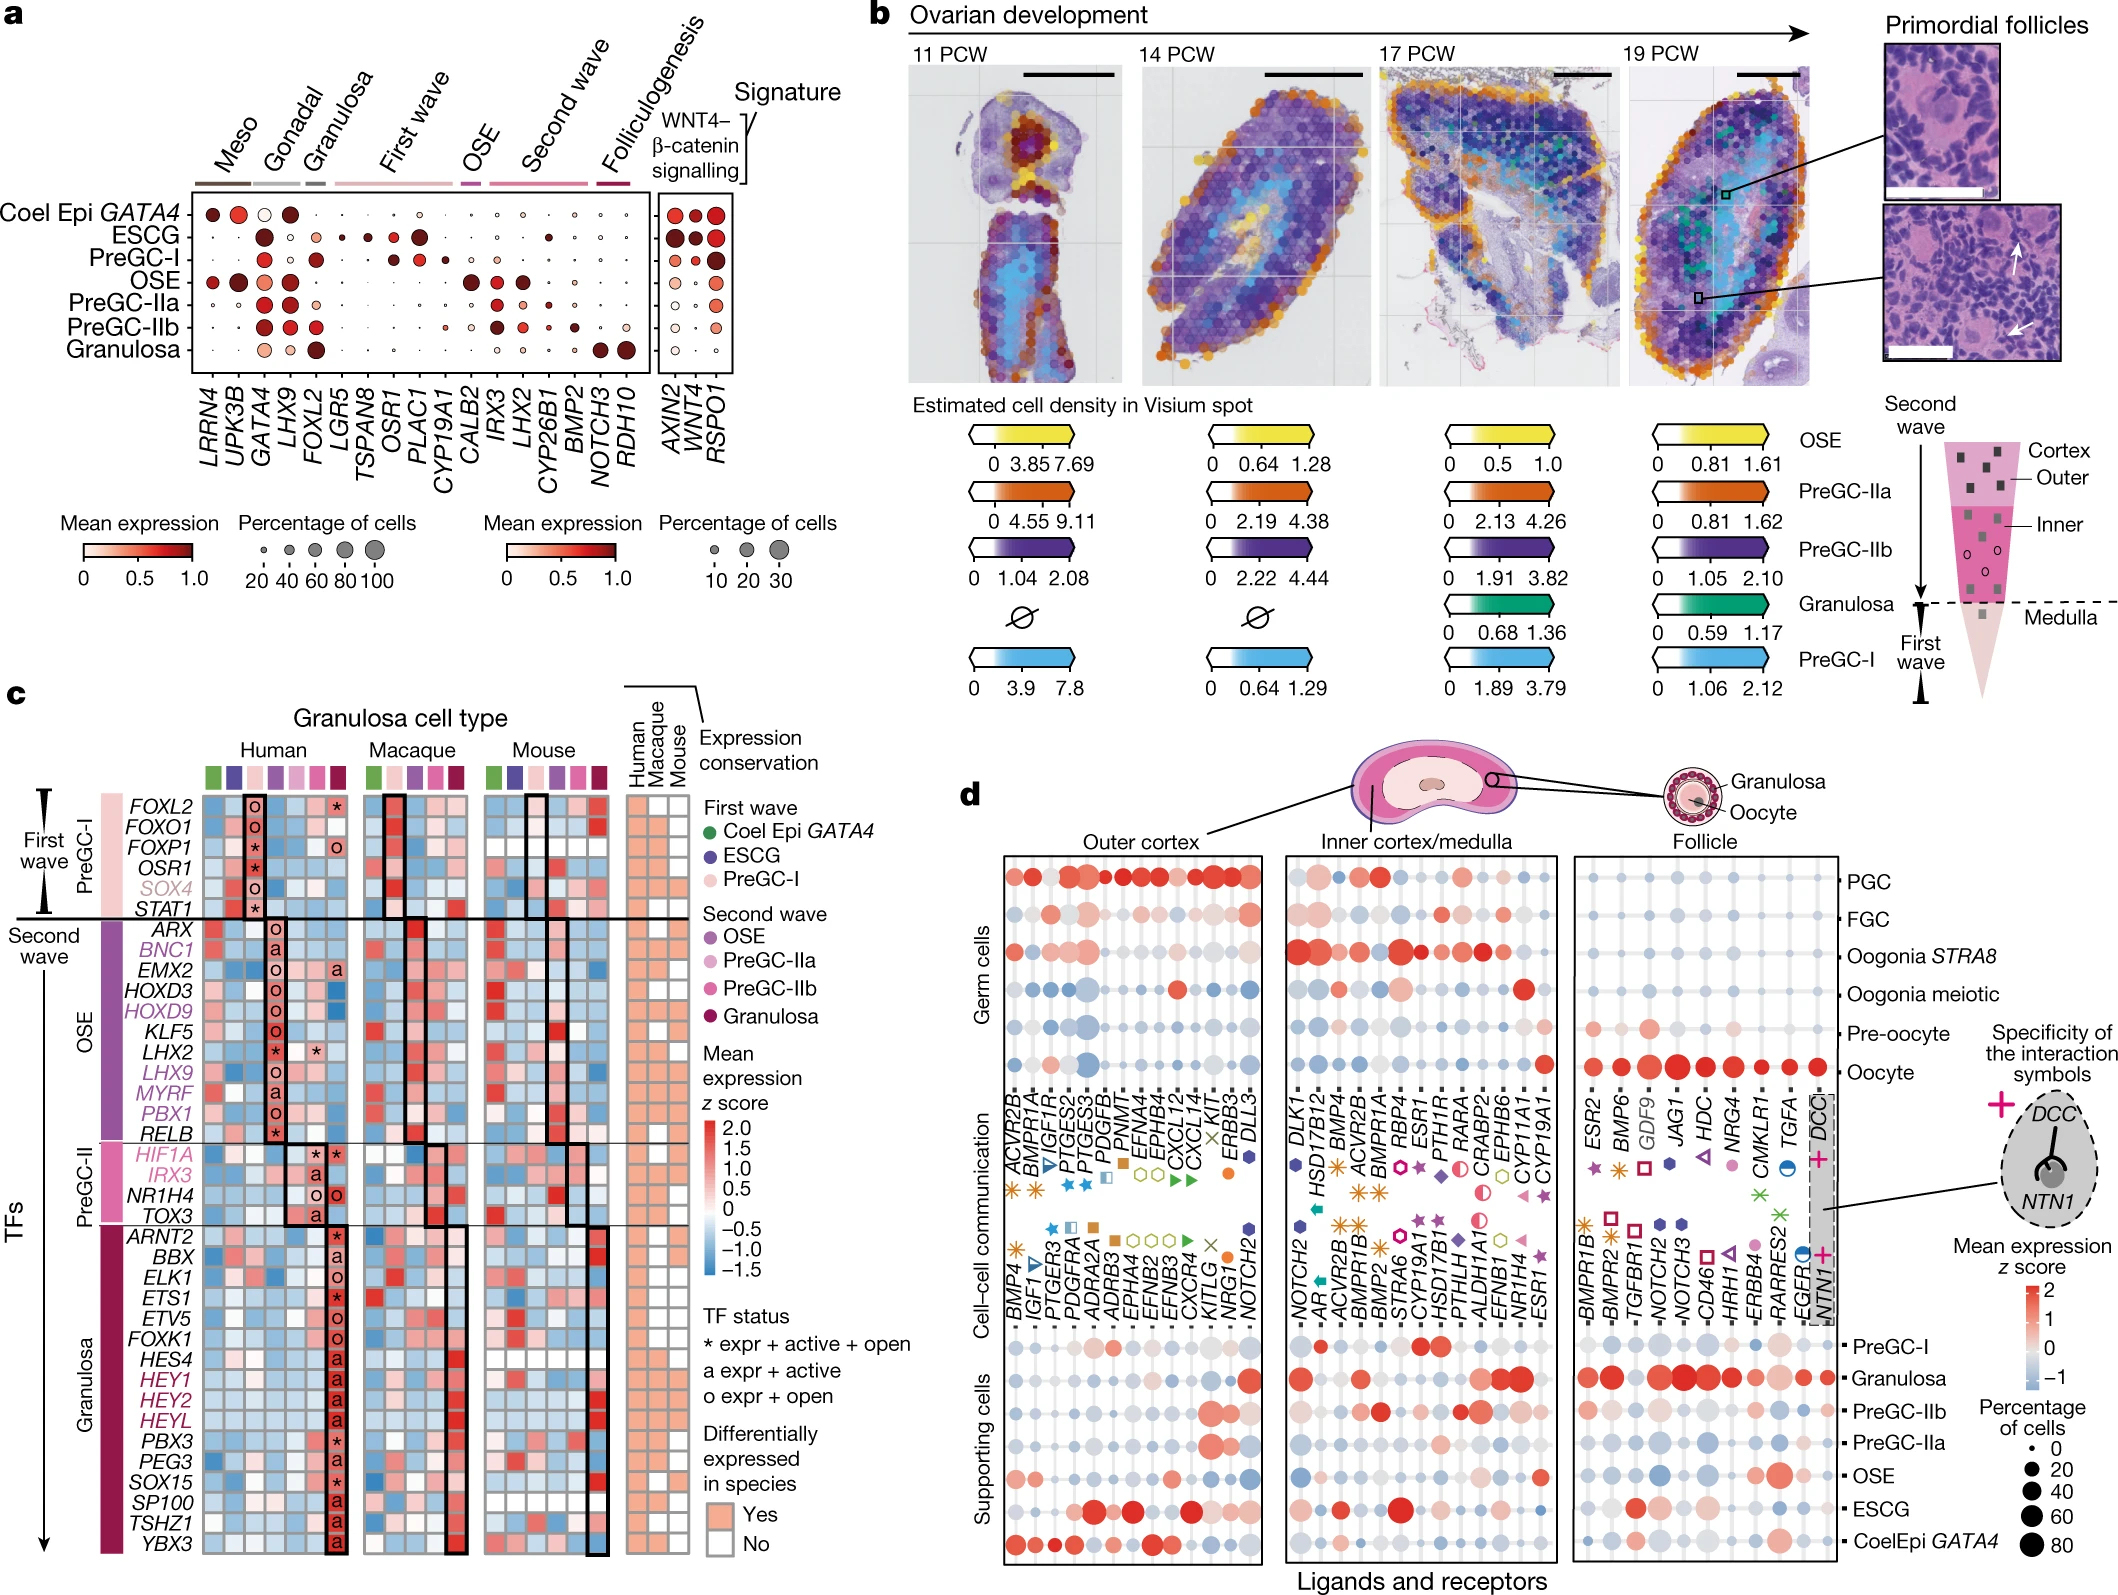
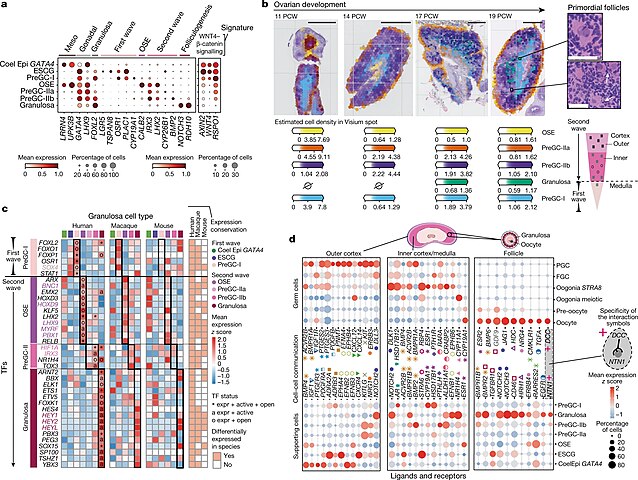
| Description | Figure 4. Transcriptional, spatiotemporal and paracrine signatures of human pregranulosa cells. a, Dot plots show the variance-scaled, log-transformed expression of genes (x-axis) characteristic of ovarian supporting cells (y-axis) in human scRNA-seq data. Top layer groups marker genes by categories. b, Spatial mapping of granulosa cell types from the scRNA-seq human dataset to spatial transcriptomics slide of 11, 14, 17 and 19 PCW ovaries using cell2location; n = 2. Estimated cell abundance (colour intensity) for OSE, preGC-I, preGC-IIa, preGC-IIb and developing granulosa cells (colour) in each Visium spot shown over the haematoxylin and eosin (H&E) images. The black rectangles highlight enlarged ovarian regions with forming follicles (top right). Schematic representation of the spatial organization of pregranulosa cell states in the human ovary (bottom right). Scale bars 1 mm (left) and 50 µm in magnified regions (right). c, Heatmaps showing expression of selected TFs across human, macaque and mouse ovarian supporting cells. Colour proportional to scaled log-transformed expression. For human ovarian supporting cells only, 'o' denotes TF whose binding motifs are differentially accessible (that is, TF can bind their potential targets); 'a' denotes TF whose targets are also differentially expressed (that is, differentially activated TF) and asterisk denotes TF that meets both 'o' and 'a' conditions. Conservation heatmap (right) highlights significant overexpression (log2 fold change > 0 and FDR < 0.05) in each species. TFs whose upregulation is conserved across species are highlighted with bold/coloured labels. d, Dot plots showing scaled z scored expression of genes coding for interacting ligand–receptor proteins (CellPhoneDB) in supporting and germ cell states in the outer cortex, inner cortex and primordial follicles. Specific interacting partners are linked with a matching symbol. CoelEpi, coelomic epithelium; Expr, expressed; FGC, fetal germ cells; preGC, pregranulosa cells; granulosa, developing granulosa. |
| Date | |
| Source | https://www.nature.com/articles/s41586-022-04918-4/ Single-cell roadmap of human gonadal development. Nature 607, 540–547 (2022). https://doi.org/10.1038/s41586-022-04918-4 |
| Author | Garcia-Alonso, L., Lorenzi, V., Mazzeo, C.I. et al. |

|
This file, which was originally posted to an external website, has not yet been reviewed by an administrator or reviewer to confirm that the above license is valid. See Category:License review needed for further instructions.
|
Open Access This article is licensed under a Creative Commons Attribution 4.0 International License, which permits use, sharing, adaptation, distribution and reproduction in any medium or format, as long as you give appropriate credit to the original author(s) and the source, provide a link to the Creative Commons license, and indicate if changes were made. The images or other third party material in this article are included in the article’s Creative Commons license, unless indicated otherwise in a credit line to the material. If material is not included in the article’s Creative Commons license and your intended use is not permitted by statutory regulation or exceeds the permitted use, you will need to obtain permission directly from the copyright holder. To view a copy of this license, visit https://creativecommons.org/licenses/by/4.0/.
Licensing
[edit]
- You are free:
- to share – to copy, distribute and transmit the work
- to remix – to adapt the work
- Under the following conditions:
- attribution – You must give appropriate credit, provide a link to the license, and indicate if changes were made. You may do so in any reasonable manner, but not in any way that suggests the licensor endorses you or your use.
File history
Click on a date/time to view the file as it appeared at that time.
| Date/Time | Thumbnail | Dimensions | User | Comment | |
|---|---|---|---|---|---|
| current | 17:17, 10 July 2024 | | 2,118 × 1,595 (1.91 MB) | Rasbak (talk | contribs) | {{Information |description=Figure 4. Transcriptional, spatiotemporal and paracrine signatures of human pregranulosa cells. a, Dot plots show the variance-scaled, log-transformed expression of genes (x-axis) characteristic of ovarian supporting cells (y-axis) in human scRNA-seq data. Top layer groups marker genes by categories. b, Spatial mapping of granulosa cell types from the scRNA-seq human dataset to spatial transcriptomics slide of 11, 14, 17 and 19 PCW ovaries using cell2location; n = 2... |
You cannot overwrite this file.
File usage on Commons
There are no pages that use this file.