File:The 304 A He + absorption line in the spectrum of quasar HE 2347-4342 (eso9720c).tiff
Original file (1,051 × 687 pixels, file size: 61 KB, MIME type: image/tiff)
Captions
Summary
[edit]DescriptionThe 304 A He + absorption line in the spectrum of quasar HE 2347-4342 (eso9720c).tiff |
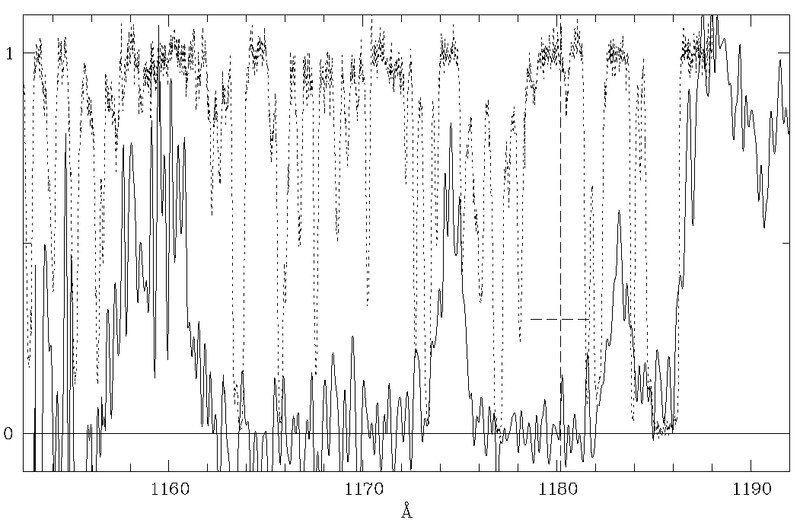
English: This diagram shows a small part of the far-ultraviolet spectrum of the newly discovered, unusually bright quasar HE 2347-4342 (redshift z = 2.885). It was obtained in June 1996 with the GHRS instrument at the Hubble Space Telescope during a total exposure time of about 6 hours. The abscissa unit is Angstrom (1 A = 10 -10 m); the ordinate is relative intensity (brightness). The spectral resolution is about 0.7 A. The recorded spectrum in this region is indicated with a fully drawn line. As can be seen, the intensity is virtually zero in several areas, for instance in the 1162 - 1172 A and 1176 - 1182 A intervals (`troughs'). This is due to He + -ions in the foreground of the quasar, strongly absorbing the light from the quasar in the redshifted 304 A helium line. Since a particular wavelength corresponds to a particular redshift and therefore to a certain distance along the line of sight, the amount of absorption at a given wavelength is a direct measure of the number of ions at a given distance from the quasar. |
||
Date | 1 August 1997 (upload date) | ||
Source |
|
||
Author | ESO | ||
Other versions |
|
Licensing
[edit]This media was created by the European Southern Observatory (ESO).
Their website states: "Unless specifically noted, the images, videos, and music distributed on the public ESO website, along with the texts of press releases, announcements, pictures of the week, blog posts and captions, are licensed under a Creative Commons Attribution 4.0 International License, and may on a non-exclusive basis be reproduced without fee provided the credit is clear and visible." To the uploader: You must provide a link (URL) to the original file and the authorship information if available. | |
This file is licensed under the Creative Commons Attribution 4.0 International license.
|
File history
Click on a date/time to view the file as it appeared at that time.
Date/Time | Thumbnail | Dimensions | User | Comment | |
---|---|---|---|---|---|
current | 00:54, 25 June 2024 | 1,051 × 687 (61 KB) | OptimusPrimeBot (talk | contribs) | #Spacemedia - Upload of https://www.eso.org/public/archives/images/original/eso9720c.tif via Commons:Spacemedia |
You cannot overwrite this file.
File usage on Commons
The following page uses this file:
Metadata
This file contains additional information such as Exif metadata which may have been added by the digital camera, scanner, or software program used to create or digitize it. If the file has been modified from its original state, some details such as the timestamp may not fully reflect those of the original file. The timestamp is only as accurate as the clock in the camera, and it may be completely wrong.
Image title | This diagram shows a small part of the far-ultraviolet spectrum of the newly discovered, unusually bright quasar HE 2347-4342 (redshift z = 2.885). It was obtained in June 1996 with the GHRS instrument at the Hubble Space Telescope during a total exposure time of about 6 hours. The abscissa unit is Angstrom (1 A = 10 -10 m); the ordinate is relative intensity (brightness). The spectral resolution is about 0.7 A.The recorded spectrum in this region is indicated with a fully drawn line. As can be seen, the intensity is virtually zero in several areas, for instance in the 1162 - 1172 A and 1176 - 1182 A intervals (`troughs'). This is due to He + -ions in the foreground of the quasar, strongly absorbing the light from the quasar in the redshifted 304 A helium line. Since a particular wavelength corresponds to a particular redshift and therefore to a certain distance along the line of sight, the amount of absorption at a given wavelength is a direct measure of the number of ions at a given distance from the quasar.The He + -spectrum has been overlaid (dashed line) by the spectrum of hydrogen (the redshifted 1215 A Lyman-alpha line, as observed at 4700 A with the CASPEC instrument at the ESO 3.6-m telescope), shifted by the appropriate factor (304/1215) in order to allow a direct comparison of the space distributions of hydrogen and helium.The hydrogen spectrum also displays many absorption minima, but all of these are comparatively narrow. This implies the existence of small and relatively dense clouds with hydrogen, situated along the line of sight. In between, there is little absorption (the relative intensity is near 1) - this corresponds to `voids' in which little hydrogen is present, cf. the areas near 1160 A and 1174-5 A. Here, the absorption by He + -ions is also comparitively small, thus these ions are also less numerous in these voids.As described in ESO Press Release eso9720 (1 August 1997), a detailed analysis of these data has shown that the observed troughs correspond to large space regions of not yet fully ionized helium.This is the first time that is has been possible to look back to the re-ionization epoch in the early Universe, a few billion years after the Big Bang . |
---|---|
Width | 1,051 px |
Height | 687 px |
Bits per component | 8 |
Compression scheme | LZW |
Pixel composition | Black and white (Black is 0) |
Orientation | Normal |
Number of components | 1 |
Number of rows per strip | 7 |
Data arrangement | chunky format |
White point chromaticity |
|
Chromaticities of primarities |
|