File:Sunspot-co2.jpg
Jump to navigation
Jump to search
Size of this preview: 745 × 600 pixels. Other resolutions: 298 × 240 pixels | 596 × 480 pixels | 971 × 782 pixels.
Original file (971 × 782 pixels, file size: 71 KB, MIME type: image/jpeg)
Captions
Captions
Add a one-line explanation of what this file represents

|
File:Temp-sunspot-co2.svg is a vector version of this file. It should be used in place of this JPG file when not inferior.
File:Sunspot-co2.jpg → File:Temp-sunspot-co2.svg
For more information, see Help:SVG. |
 |
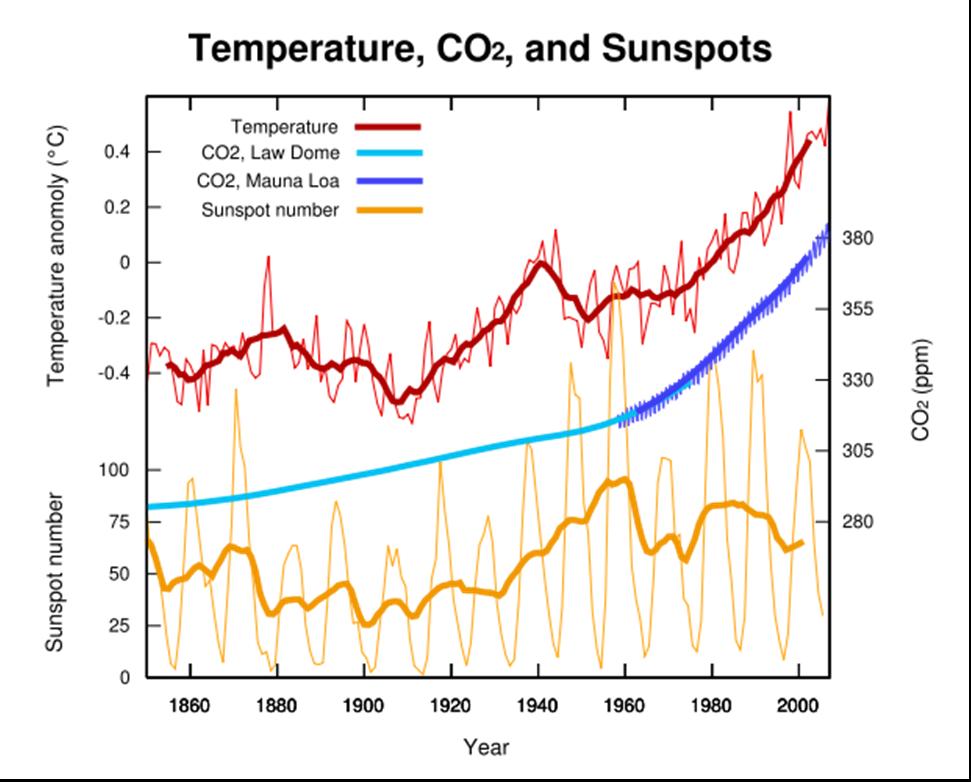
- English: Global average temperature, atmospheric CO2, and sunspot activity since 1850. Thick lines for temperature and sunspots represent a 25 year moving average smoothing of the raw data
Français : Evolution récente de la température mondiale moyenne et du taux moyen de CO2 atmosphérique, comparé à l'activité des w:fr:taches solairestaches solaires depuis 1850. Les lignes épaisses de variation de température et de taches solaires représentent un lissage des données (sur 25 années de données brutes)
Source
[edit]
Data Sources
[edit]
- (light blue) Law Dome CO2 Data: ftp://ftp.ncdc.noaa.gov/pub/data/paleo/icecore/antarctica/law/law_co2.txt
- (blue) Mauna Loa CO2 data:http://www.esrl.noaa.gov/gmd/ccgg/trends/co2_mm_mlo.dat
- (red) Temperature Data: http://www.cru.uea.ac.uk/cru/data/temperature/hadcrut3gl.txt archive copy at the Wayback Machine
- (orange) Sunspot data:http://sidc.oma.be/DATA/yearssn.dat archive copy at the Wayback Machine
Plot Generation
[edit]
This plot was created with Matplotlib.
The plot was generated by the following Python script:
# -*- coding: utf-8 -*-
import numpy as np
import matplotlib.pylab as plt
import urllib

def smooth(signal, window_size):
    extended_signal = signal[window_size:0:-1] + signal + signal[-1:-window_size:-1]
    s = np.array(extended_signal)
    w = np.hamming(window_size)
    y = np.convolve(w/w.sum(), s, mode="same")
    return y[window_size:-window_size+1]

temp_file = urllib.urlopen("http://www.cru.uea.ac.uk/cru/data/temperature/hadcrut3gl.txt")
data_rows = [x.split() for x in temp_file][0:-1:2]
temp_years = [int(x[0]) for x in data_rows]
temps = [float(x[-1]) for x in data_rows]

#co2_file = urllib.urlopen("http://web.archive.org/web/20070829134646/http://www.esrl.noaa.gov/gmd/ccgg/trends/co2_mm_mlo.dat")
co2_file = urllib.urlopen("ftp://ftp.cmdl.noaa.gov/ccg/co2/trends/co2_mm_mlo.txt")
data_rows = [x.split() for x in co2_file if not x.startswith("#") and x.find("-99.99") == -1]
co2_years = [(float(x[0]) + (float(x[1])-0.5)/12.) for x in data_rows]
co2concs = [float(x[3]) for x in data_rows]

lawco2_file = urllib.urlopen("ftp://ftp.ncdc.noaa.gov/pub/data/paleo/icecore/antarctica/law/law_co2.txt")
data_rows = [x.split() for x in lawco2_file if x.startswith("     1")]
del data_rows[[float(x[0]) for x in data_rows].index(1010.):]
lawco2_years = [float(x[0]) for x in data_rows]
lawco2concs = [float(x[-1]) for x in data_rows]

sunspot_file = urllib.urlopen("http://sidc.oma.be/DATA/yearssn.dat")
data_rows = [x.split() for x in sunspot_file if "*" not in x]
sun_years = [float(x[0]) for x in data_rows]
sunspots = [float(x[-1]) for x in data_rows]

smoothed_temps = smooth(temps, 25)
smoothed_sunspots = smooth(sunspots, 25)

base_ax = plt.axes()
base_ax.yaxis.tick_left()
plt.yticks([])
plt.xlim(1850,2012)
plt.xlabel("Year", size=16)
plt.title("Temperature, CO$_2$, and Sunspots", size=22)

temp_ax = plt.axes([0.125,0.5,0.775,0.4], frameon=False)
temp_ax.yaxis.tick_left()
plt.plot(temp_years, temps, '#FF2200')
tline  = plt.plot(temp_years, smoothed_temps, '#AA0000', lw=3)
plt.xlim(1850,2012)
plt.yticks(np.arange(-0.6,0.6,0.2))
plt.ylabel(u'Temperature anomaly (C)', size=14)
plt.xticks([])

co2_ax = plt.axes([0.125,0.3,0.775,0.4], frameon=False)
co2_ax.yaxis.tick_right()
co2_ax.yaxis.set_label_position("right")
co2_ax.xaxis.tick_bottom()
plt.plot(co2_years, co2concs, '#44AAFF')
cline = plt.plot(lawco2_years, lawco2concs, '#2288EE', lw=2)
plt.xlim(1850,2012)
plt.ylabel(r'CO$_2$ (ppm)', size=14)
plt.xticks([])

sun_ax = plt.axes([0.125,0.1,0.775,0.4], frameon=False)
sun_ax.yaxis.tick_left()
plt.plot(sun_years, sunspots, "#FFDD00")
sline = plt.plot(sun_years, smoothed_sunspots, "#FF9900", lw=3)
plt.xlim(1850,2012)
plt.yticks(np.arange(0,200,50))
plt.ylabel("Sunspot number", size=14)
plt.xticks([])

plt.axes(base_ax)
plt.legend((tline, cline, sline), ("Temperature", "CO$_2$", "Sunspots"), "upper left")
plt.savefig("temp-co2-sunspot.svg")
plt.show()
The plot can likely be updated for more recent data using these same script, though minor modifications may be required for changes in data formats, locations, etc.
I, the copyright holder of this work, hereby publish it under the following license:
| This file is licensed under the Creative Commons Attribution-Share Alike 3.0 Unported license. Subject to disclaimers. | ||
| ||
| This licensing tag was added to this file as part of the GFDL licensing update. |

|
Permission is granted to copy, distribute and/or modify this document under the terms of the GNU Free Documentation License, Version 1.2 or any later version published by the Free Software Foundation; with no Invariant Sections, no Front-Cover Texts, and no Back-Cover Texts. A copy of the license is included in the section entitled GNU Free Documentation License. Subject to disclaimers. |
File history
Click on a date/time to view the file as it appeared at that time.
| Date/Time | Thumbnail | Dimensions | User | Comment | |
|---|---|---|---|---|---|
| current | 10:12, 17 June 2007 | | 971 × 782 (71 KB) | Szdori (talk | contribs) | *en: Global average temperature, atmospheric CO2, and sunspot activity since 1850. *Source: [http://en.wikipedia.org/wiki/Image:Temp-sunspot-co2.svg] {{GFDL-self-with-disclaimers}} |
You cannot overwrite this file.
File usage on Commons
The following 2 pages use this file:
File usage on other wikis
The following other wikis use this file:
- Usage on fa.wikipedia.org