Category:Sunspot diagrams
Jump to navigation
Jump to search
Media in category "Sunspot diagrams"
The following 71 files are in this category, out of 71 total.
-
 800px-Carbon14-sunspot.png 800 × 560; 139 KB
-

-
 Carbon-14 with sunspots since 1700.png 1,006 × 332; 24 KB
-
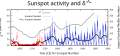 Carbon14-sunspot.svg 1,023 × 475; 340 KB
-
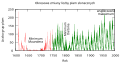
 Changes in total solar irradiance and monthly sunspot numbers, 1975-2013 NO.png 2,318 × 1,746; 314 KB
-
 Changes in total solar irradiance and monthly sunspot numbers, 1975-2013-da.png 2,318 × 1,746; 303 KB
-
 Changes in total solar irradiance and monthly sunspot numbers, 1975-2013-es.png 2,318 × 1,746; 217 KB
-
 Changes in total solar irradiance and monthly sunspot numbers, 1975-2013.png 2,318 × 1,746; 289 KB
-
 CinemaAttrSunSpot.gif 800 × 600; 1.27 MB
-
 Cwt-sunspots.png 1,024 × 645; 11 KB
-
 Doa la Jua.jpg 645 × 593; 72 KB
-
 Earth obs fig26.png 6,400 × 4,799; 2.7 MB
-

-
 George E. Hale - The law of sunspot polarity, 1903-1934.jpg 898 × 372; 41 KB
-

-

-

-
 Illustration of sunspots from “Ars Magna Lucis et Umbrae” 01.jpg 438 × 501; 91 KB
-
 Joy's law diagram full disk.svg 600 × 600; 21 KB
-
 Joy's law diagram.svg 1,000 × 700; 242 KB
-
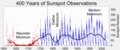
 Maunder Minimum and Little Ice Age.tif 690 × 780; 329 KB
-
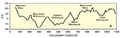
 Maunder minimum.gif 513 × 387; 30 KB
-

-
 Motylkovy diagram.gif 350 × 98; 10 KB
-
 Mpl example temp co2 sun.svg 720 × 540; 123 KB
-
 NASAdata1979to2009.jpg 1,046 × 716; 304 KB
-
 Power spectrum of sunspot number, from 1945 to 2017.png 959 × 1,560; 325 KB
-
 Predictions3 strip.jpg 500 × 250; 27 KB
-
 PSM V72 D501 Relationship graph between sunspots and geological activity.png 2,697 × 1,655; 269 KB
-
 PSM V72 D502 Relative frequency of sunspots and seismic activity charts.png 1,654 × 1,990; 165 KB
-

-
 PSM V72 D506 Data reference table of the sunspot activity charts.png 1,738 × 935; 148 KB
-
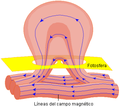 Solar flare diagram ES.png 324 × 290; 31 KB
-
 Sonnenfleckenaktivitaet C14.png 1,002 × 317; 24 KB
-
 Spotdecay PvDG97.png 443 × 349; 23 KB
-
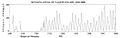 Ssn anual.jpg 800 × 253; 29 KB
-
 SSN Predict SWPC.gif 720 × 550; 3.4 MB
-
 Ssn yearly it.jpg 800 × 253; 67 KB
-
 Ssn yearly.jpg 906 × 286; 27 KB
-
 Sun spot diag Lmb German.PNG 324 × 290; 24 KB
-
 Sunspot area variation.svg 1,613 × 430; 84 KB
-
 Sunspot butterfly diagram black.svg 1,613 × 510; 522 KB
-
 Sunspot butterfly diagram.svg 1,613 × 510; 489 KB
-
 Sunspot butterfly graph.gif 2,150 × 1,280; 142 KB
-
 Sunspot butterfly with graph.gif 2,048 × 1,280; 132 KB
-
 Sunspot diagram.svg 648 × 580; 8 KB
-
 Sunspot Number-it.png 1,000 × 425; 39 KB
-
 Sunspot Numbers German.png 1,000 × 425; 36 KB
-
 Sunspot numbers pl.svg 710 × 375; 282 KB
-
 Sunspot Numbers-fr.svg 1,000 × 425; 64 KB
-
 Sunspot Numbers.png 1,813 × 762; 115 KB
-
 Sunspot Numbers.svg 660 × 400; 294 KB
-
 Sunspot-bfly.gif 2,150 × 1,280; 142 KB
-
 Sunspot-co2.jpg 971 × 782; 71 KB
-
 Sunspot-number.png 1,250 × 875; 190 KB
-
 Sunspot-temperature-10000yr.svg 600 × 480; 30 KB
-
 Sunspots 11000 years.jpg 721 × 388; 40 KB
-
 Sunspots 11000 years.svg 1,360 × 700; 15 KB
-
 Sunspots Zurich.gif 800 × 600; 16 KB
-
 Sunspots-gn-yr-total-smoothed-de.svg 1,000 × 425; 34 KB
-
 Sunspots-gn-yr-total-smoothed-en.svg 1,000 × 425; 33 KB
-
 Sunspots-reconstructed-0-2015-de-mca.svg 1,000 × 400; 88 KB
-
 Sunspots-reconstructed-0-2015-de.svg 1,000 × 400; 61 KB
-
 Sunspots-reconstructed-0-2015-en-mca.svg 1,000 × 400; 88 KB
-
 Sunspots-reconstructed-0-2015-en.svg 1,000 × 400; 61 KB
-
 Sunspots-reconstructed-0-2015-labels-en.svg 1,000 × 500; 51 KB
-
 Synoptic-solmag.jpg 1,300 × 600; 192 KB
-
 Temp-sunspot-co2.svg 720 × 540; 98 KB
-
 Voyage in Space page201.png 1,552 × 1,055; 494 KB
-
 Zurich sunspot number since 1750.png 768 × 1,045; 53 KB
-
 太陽活動と気温の変化.png 1,080 × 859; 95 KB

_and_butterfly_graph_(1877-1902)_of_sunspot_latitude_during_the_solar_cycle.jpg)


,_1904.jpg)


.png)