File:Projected U.S. Precipitation Changes by 2100.webm
Original file (WebM audio/video file, VP8/Vorbis, length 1 min 1 s, 1,280 × 720 pixels, 911 kbps overall, file size: 6.58 MB)
Captions
Captions
Summary
[edit]| Description |
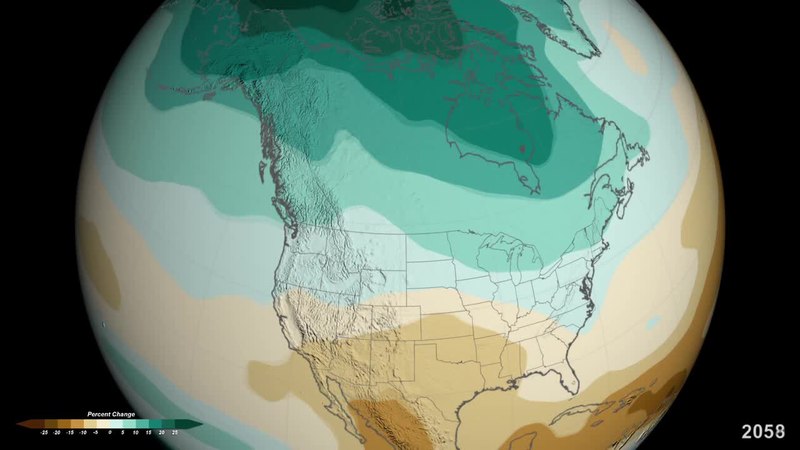
English: The climate of the southwestern U.S. could be a lot drier by 2100. The climate of the northeastern U.S. could be a lot wetter.
New visualizations of computer model projections show how precipitation patterns could change across the U.S. in the coming decades under two different carbon dioxide emissions scenarios. The two climate scenarios, based on "low" and "high" levels of carbon dioxide emissions, highlight results from the draft National Climate Assessment. Both scenarios project that dry regions get drier and regions that see more rain and snow would see that trend increase. The scenario with lower emissions, in which carbon dioxide reaches 550 parts per million by 2100, projects more subtle changes. The scenario with higher carbon dioxide emissions projects changes in average annual precipitation of 10 percent or more in some regions. The visualizations, which combine the results from 15 global climate models, present projections of precipitation changes from 2000 to 2100 compared to the historical average from 1970 -1999. They were produced by the Scientific Visualization Studio at NASA's Goddard Space Flight Center, Greenbelt, Md., in collaboration with NOAA's National Climatic Data Center and the Cooperative Institute for Climate and Satellites, both in Asheville, N.C. The visualizations show the precipitation changes as a 30-year running average. The date seen in the bottom-right corner is the mid-point of the 30-year average being shown. "These visualizations communicate a picture of the impacts of climate change in a way that words do not," says Allison Leidner, Ph.D., a scientist who coordinates NASA's involvement in the National Climate Assessment "When I look at the scenarios for future temperature and precipitation, I really see how dramatically our nation's climate could change." This video is public domain and can be downloaded at: http://svs.gsfc.nasa.gov/vis/a010000/a011200/a011281/ |
| Date | |
| Source | YouTube: NASA – View/save archived versions on archive.org and archive.today |
| Author | NASA Goddard |
Licensing
[edit]| This file is in the public domain in the United States because it was solely created by NASA. NASA copyright policy states that "NASA material is not protected by copyright unless noted". (See Template:PD-USGov, NASA copyright policy page or JPL Image Use Policy.) | ||
 |
Warnings:
|
File history
Click on a date/time to view the file as it appeared at that time.
| Date/Time | Thumbnail | Dimensions | User | Comment | |
|---|---|---|---|---|---|
| current | 14:29, 4 October 2013 | 1 min 1 s, 1,280 × 720 (6.58 MB) | 培养皿 (talk | contribs) | User created page with UploadWizard |
You cannot overwrite this file.
File usage on Commons
The following page uses this file: