File:Phased-antenna-array-principle.webm
Jump to navigation
Jump to search
Size of this JPG preview of this WEBM file: 599 × 600 pixels. Other resolutions: 240 × 240 pixels | 479 × 480 pixels | 719 × 720 pixels.
Original file (WebM audio/video file, VP9, length 30 s, 719 × 720 pixels, 1.2 Mbps overall, file size: 4.24 MB)
Captions
Captions
Add a one-line explanation of what this file represents
Summary
[edit]| Description |
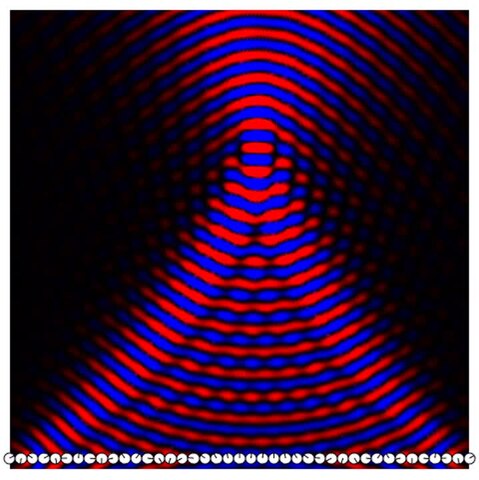
English: If you can control the relative phase of a number of point emitters, you can control the shape of your propagating wave. |
| Date | |
| Source | https://twitter.com/j_bertolotti/status/1252635852867547137 |
| Author | Jacopo Bertolotti |
| Permission (Reusing this file) |
https://twitter.com/j_bertolotti/status/1030470604418428929 |
Mathematica 12.0 code
[edit]\[Lambda] = 1;
k0 = (2 \[Pi])/\[Lambda];
\[Alpha] = (4 I)/k0^2;
\[Sigma] = (k0^3 Norm[\[Alpha]]^2)/4;
G[r_] := N[I/4 HankelH1[0, k0 Norm[r] ]];
ReMapC[x_] := RGBColor[(Cos[2 \[Pi] x] + 1)/2 UnitStep[x - 0.5], 0, (Cos[2 \[Pi] x] + 1)/2 UnitStep[0.5 - x]];
pos = Riffle[Range[0, 10, \[Lambda]/2],
Reverse@Range[-10, -\[Lambda]/2, \[Lambda]/2] ];
dim = Dimensions[pos][[1]]
p0 = Table[
\[Theta] = Table[0, {j, 1, dim}];
source =
Sum[G[{x - pos[[j]], y} ] E^(I \[Theta][[j]]), {j, 1, nsources}];
DensityPlot[
Re[source], {x, -10, 10}, {y, -\[Lambda]/2, 20 - \[Lambda]/2},
PlotPoints -> 60, ColorFunction -> ReMapC, Frame -> False,
PlotRange -> {-0.25, 0.25}, Exclusions -> None,
Epilog -> {White,
Table[Disk[{pos[[j]], 0}, \[Lambda]/4], {j, 1, nsources}],
Black, Table[
Circle[{pos[[j]], 0}, \[Lambda]/4], {j, 1, nsources}],
Table[
Line[{{pos[[j]],
0}, {pos[[j]], 0} + \[Lambda]/
4 {Sin[\[Theta][[j]] ], Cos[\[Theta][[j]] ]}}], {j, 1,
nsources}]}
]
, {nsources, 1, dim, 1}];
pos = Range[-10, 10, \[Lambda]/2];
dim = Dimensions[pos][[1]]
p1 = Table[
\[Theta] = (1 - Cos[ \[Pi] t])/2*
Table[2 \[Pi] pos[[j]]/20, {j, 1, dim}];
source =
Sum[G[{x - pos[[j]], y} ] E^(I \[Theta][[j]]), {j, 1, dim}];
DensityPlot[Re[source], {x, -10, 10}, {y, -\[Lambda]/2, 20},
PlotPoints -> 60, ColorFunction -> ReMapC, Frame -> False,
PlotRange -> {-0.25, 0.25}, Exclusions -> None,
Epilog -> {White,
Table[Disk[{pos[[j]], 0}, \[Lambda]/4], {j, 1, dim}], Black,
Table[Circle[{pos[[j]], 0}, \[Lambda]/4], {j, 1, dim}],
Table[
Line[{{pos[[j]],
0}, {pos[[j]], 0} + \[Lambda]/
4 {Sin[\[Theta][[j]] ], Cos[\[Theta][[j]] ]}}], {j, 1,
dim}]}
]
, {t, 0, 1, 0.05}];
p3 = Table[
\[Theta] = (1 - Cos[ \[Pi] t])/2*
Table[-2 \[Pi] pos[[j]]^2/30, {j, 1, dim}];
source =
Sum[G[{x - pos[[j]], y} ] E^(I \[Theta][[j]]), {j, 1, dim}];
DensityPlot[Re[source], {x, -10, 10}, {y, -\[Lambda]/2, 20},
PlotPoints -> 60, ColorFunction -> ReMapC, Frame -> False,
PlotRange -> {-0.25, 0.25}, Exclusions -> None,
ClippingStyle -> {Blue, Red},
Epilog -> {White,
Table[Disk[{pos[[j]], 0}, \[Lambda]/4], {j, 1, dim}], Black,
Table[Circle[{pos[[j]], 0}, \[Lambda]/4], {j, 1, dim}],
Table[
Line[{{pos[[j]],
0}, {pos[[j]], 0} + \[Lambda]/
4 {Sin[\[Theta][[j]] ], Cos[\[Theta][[j]] ]}}], {j, 1,
dim}]}]
, {t, 0, 1, 0.05}];
p4 = Table[
\[Theta] =
Table[-2 \[Pi] pos[[j]]^2/30 + (1 - Cos[ \[Pi] t])/
2*2 \[Pi] pos[[j]]/10, {j, 1, dim}];
source =
Sum[G[{x - pos[[j]], y} ] E^(I \[Theta][[j]]), {j, 1, dim}];
DensityPlot[Re[source], {x, -10, 10}, {y, -\[Lambda]/2, 20},
PlotPoints -> 60, ColorFunction -> ReMapC, Frame -> False,
PlotRange -> {-0.25, 0.25}, Exclusions -> None,
ClippingStyle -> {Blue, Red},
Epilog -> {White,
Table[Disk[{pos[[j]], 0}, \[Lambda]/4], {j, 1, dim}], Black,
Table[Circle[{pos[[j]], 0}, \[Lambda]/4], {j, 1, dim}],
Table[
Line[{{pos[[j]],
0}, {pos[[j]], 0} + \[Lambda]/
4 {Sin[\[Theta][[j]] ], Cos[\[Theta][[j]] ]}}], {j, 1,
dim}]}]
, {t, 0, 1, 0.05}];
p5 = Table[
\[Theta] = (1 - Cos[ \[Pi] t])/2*
Table[-2 \[Pi] pos[[j]]^3/300, {j, 1, dim}];
source =
Sum[G[{x - pos[[j]], y} ] E^(I \[Theta][[j]]), {j, 1, dim}];
DensityPlot[Re[source], {x, -10, 10}, {y, -\[Lambda]/2, 20},
PlotPoints -> 60, ColorFunction -> ReMapC, Frame -> False,
PlotRange -> {-0.25, 0.25}, Exclusions -> None,
ClippingStyle -> {Blue, Red},
Epilog -> {White,
Table[Disk[{pos[[j]], 0}, \[Lambda]/4], {j, 1, dim}], Black,
Table[Circle[{pos[[j]], 0}, \[Lambda]/4], {j, 1, dim}],
Table[
Line[{{pos[[j]],
0}, {pos[[j]], 0} + \[Lambda]/
4 {Sin[\[Theta][[j]] ], Cos[\[Theta][[j]] ]}}], {j, 1,
dim}]}]
, {t, 0, 1, 0.05}];
p6 = Table[
\[Theta] = (1 - Cos[ \[Pi] t])/2*
Table[-2 \[Pi] Abs[pos[[j]] ]/3, {j, 1, dim}];
source =
Sum[G[{x - pos[[j]], y} ] E^(I \[Theta][[j]]), {j, 1, dim}];
DensityPlot[Re[source], {x, -10, 10}, {y, -\[Lambda]/2, 20},
PlotPoints -> 60, ColorFunction -> ReMapC, Frame -> False,
PlotRange -> {-0.25, 0.25}, Exclusions -> None,
ClippingStyle -> {Blue, Red},
Epilog -> {White,
Table[Disk[{pos[[j]], 0}, \[Lambda]/4], {j, 1, dim}], Black,
Table[Circle[{pos[[j]], 0}, \[Lambda]/4], {j, 1, dim}],
Table[
Line[{{pos[[j]],
0}, {pos[[j]], 0} + \[Lambda]/
4 {Sin[\[Theta][[j]] ], Cos[\[Theta][[j]] ]}}], {j, 1,
dim}]}]
, {t, 0, 1, 0.05}];
ListAnimate[
Join[Table[p0[[1]], {5}], p0, p1, Reverse[p1], p3, p4, Reverse[p4],
Reverse[p3], p5, Reverse[p5], p6, Reverse[p6], Reverse[p0] ]
]
Licensing
[edit]I, the copyright holder of this work, hereby publish it under the following license:
| This file is made available under the Creative Commons CC0 1.0 Universal Public Domain Dedication. | |
| The person who associated a work with this deed has dedicated the work to the public domain by waiving all of their rights to the work worldwide under copyright law, including all related and neighboring rights, to the extent allowed by law. You can copy, modify, distribute and perform the work, even for commercial purposes, all without asking permission.
|
This file, which was originally posted to
https://twitter.com/j_bertolotti/status/1252635852867547137, was reviewed on 6 July 2020 by reviewer GRuban, who confirmed that it was available there under the stated license on that date.
|
File history
Click on a date/time to view the file as it appeared at that time.
| Date/Time | Thumbnail | Dimensions | User | Comment | |
|---|---|---|---|---|---|
| current | 15:37, 22 April 2020 | 30 s, 719 × 720 (4.24 MB) | Berto (talk | contribs) | Imported media from uploads:deae05fa-84ac-11ea-8457-162e1bb092a6 |
You cannot overwrite this file.
File usage on Commons
The following 3 pages use this file: