File:Periodic points of f(z) = z*z-0.75 for period =3 as intersections of 2 implicit curves.png
Jump to navigation
Jump to search

Size of this preview: 600 × 600 pixels. Other resolutions: 240 × 240 pixels | 480 × 480 pixels | 1,000 × 1,000 pixels.
Original file (1,000 × 1,000 pixels, file size: 109 KB, MIME type: image/png)
Captions
Captions
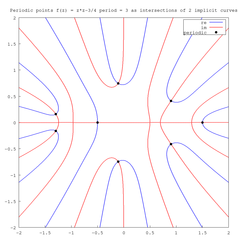
Periodic points of f(z) = z*z-0.75 for period =3 as intersections of 2 implicit curves
Summary
[edit]| Description |
English: Periodic points of f(z) = z*z-0.75 for period =3 as intersections of 2 implicit curves "(which are related by the Cauchy-Riemann equations) separately. Their intersections give the complex roots of the original function. "[1] |
| Date | |
| Source | Own work |
| Author | Adam majewski |
| Other versions |
|
_%3D_z*z-0.75_for_period_%3D6_as_intersections_of_2_implicit_curves.svg)
_%3D_z*z-0.75_for_period_%3D4_as_intersections_of_2_implicit_curves.svg)

_%3D_z*z-0.75_for_period_%3D3_as_intersections_of_2_implicit_curves.png&action=edit§ion=1)
Licensing
[edit]_%3D_z*z-0.75_for_period_%3D3_as_intersections_of_2_implicit_curves.png&action=edit§ion=2)
I, the copyright holder of this work, hereby publish it under the following license:
This file is licensed under the Creative Commons Attribution-Share Alike 4.0 International license.
- You are free:
- to share – to copy, distribute and transmit the work
- to remix – to adapt the work
- Under the following conditions:
- attribution – You must give appropriate credit, provide a link to the license, and indicate if changes were made. You may do so in any reasonable manner, but not in any way that suggests the licensor endorses you or your use.
- share alike – If you remix, transform, or build upon the material, you must distribute your contributions under the same or compatible license as the original.
Maxima CAS src code
[edit]_%3D_z*z-0.75_for_period_%3D3_as_intersections_of_2_implicit_curves.png&action=edit§ion=3)
/*

find periodic points of f^n(z,c)
zn = z0


A useful way to visualize the roots of a complex function is to plot the 0 contours of the real and imaginary parts. That is, compute z = Dm(...) on a reasonably dense grid, and then use matplotlib's contour function to plot the contours where z.real is 0 and where z.imag is zero. The roots of the function are the points where these contours intersect.
Warren Weckesser

https://stackoverflow.com/questions/24419164/storing-roots-of-a-complex-function-in-an-array-in-scipy/24421779#24421779


*/

kill(all);
remvalue(all);
ratprint:false;
numer:true$
display2d:false$


declare (z, complex)$
declare ([x,y], real)$
z:x+y*%i;


/* -------------------functions --------------------------------------*/
f(z):= z*z+c$ /* complex quadratic polynomial */

/* iterated function */
fn(n, z) :=
  if n=0
  	then z
  	else 	(if n=1
  			then f(z)
  			else f(fn(n-1, z))
  		)$

/* for periodic points {z: zp=z0 }*/
Fn(n,z) := fn(n, z) - z$

/*
converts complex number z = x*y*%i
to the list in a draw format:
[x,y]
*/
dr(z):=[float(realpart(z)), float(imagpart(z))]$

ToPoints(myList):= points(map(dr,myList))$

compile(all)$


/* constants */
period :5$

c:-3/4$


/* ------------------ computations ---------------------------------------*/
zp:  Fn(period, z)$
e1: realpart(zp )=0$
e2: imagpart(zp )=0$

/*
find periodic points using numerical method
*/
polyfactor:false$
if ( period < 6) /* allroots fails for period >5 */
	then sol: allroots(%i*Fn(period, w))
	else ( /* increase precision of numerical computations */
		print("bfloat"),
		fpprec : 32, /*Default value: 16, it is the number of significant digits for arithmetic on bigfloat numbers */
		float2bf : true,
		sol: bfallroots(%i*Fn(period, bfloat(w) ))

		)$

sol: map(rhs,sol)$
intersections:ToPoints(sol)$


dSize : 2$ /* image size in world coordinate =  x, -dSize,dSize, y, -dSize,dSize), */
path:"~/Dokumenty/newton/2/"$ /*  pwd, if empty then file is in a home dir , path should end with "/" */

/* draw it using draw package ( Maxima-Gnuplot interface) by Mario Rodríguez Riotorto */
draw2d(
	file_name = sconcat(path, string(period)),
	terminal   = pngcairo,
	dimensions = [1000,1000],
	/* the text */
  	color     = black,
  	font      = "Courier",
  	font_size = 15,
	title = sconcat("Periodic points f(z) = z*z-3/4 period = ", string(period), " as intersections of 2 implicit curves"),
	user_preamble = "set key box opaque ", /* legend ovelaps the graph */
  	/* */
  	grid       = false,
  	xaxis = false,
  	yaxis = false,
  	xaxis_type  = solid,
  	yaxis_type  = solid,
  	xaxis_color = black,
  	yaxis_color = black,
  	proportional_axes = xy,

  	/* implicit curves */
  	ip_grid = [200, 200], /* precision and time of computations for implicit curves */
  	line_width = 1.7,
  	line_type = solid,
  	/* first curve */
  	key        = "re",
  	color = blue,
  	implicit(e1, x, -dSize,dSize, y, -dSize,dSize),
  	/* second curve */
  	color      = red,
  	key        = "im",
  	implicit(e2, x, -dSize,dSize, y, -dSize,dSize),
  	/* points */
  	point_type= filled_circle,
  	point_size = 1.5,
  	color= black,
  	key = "periodic",
  	intersections

   ) $
File history
Click on a date/time to view the file as it appeared at that time.
| Date/Time | Thumbnail | Dimensions | User | Comment | |
|---|---|---|---|---|---|
| current | 11:58, 27 December 2020 | | 1,000 × 1,000 (109 KB) | Soul windsurfer (talk | contribs) | Uploaded own work with UploadWizard |
You cannot overwrite this file.
File usage on Commons
The following 3 pages use this file:
_%3D_z*z-0.75_for_period_%3D3_as_intersections_of_2_implicit_curves.png&oldid=672819422)