File:New Zealand per capita co2 comparisons.svg

Original file (SVG file, nominally 506 × 361 pixels, file size: 5 KB)
Captions
Captions
Summary
[edit]
| Description |
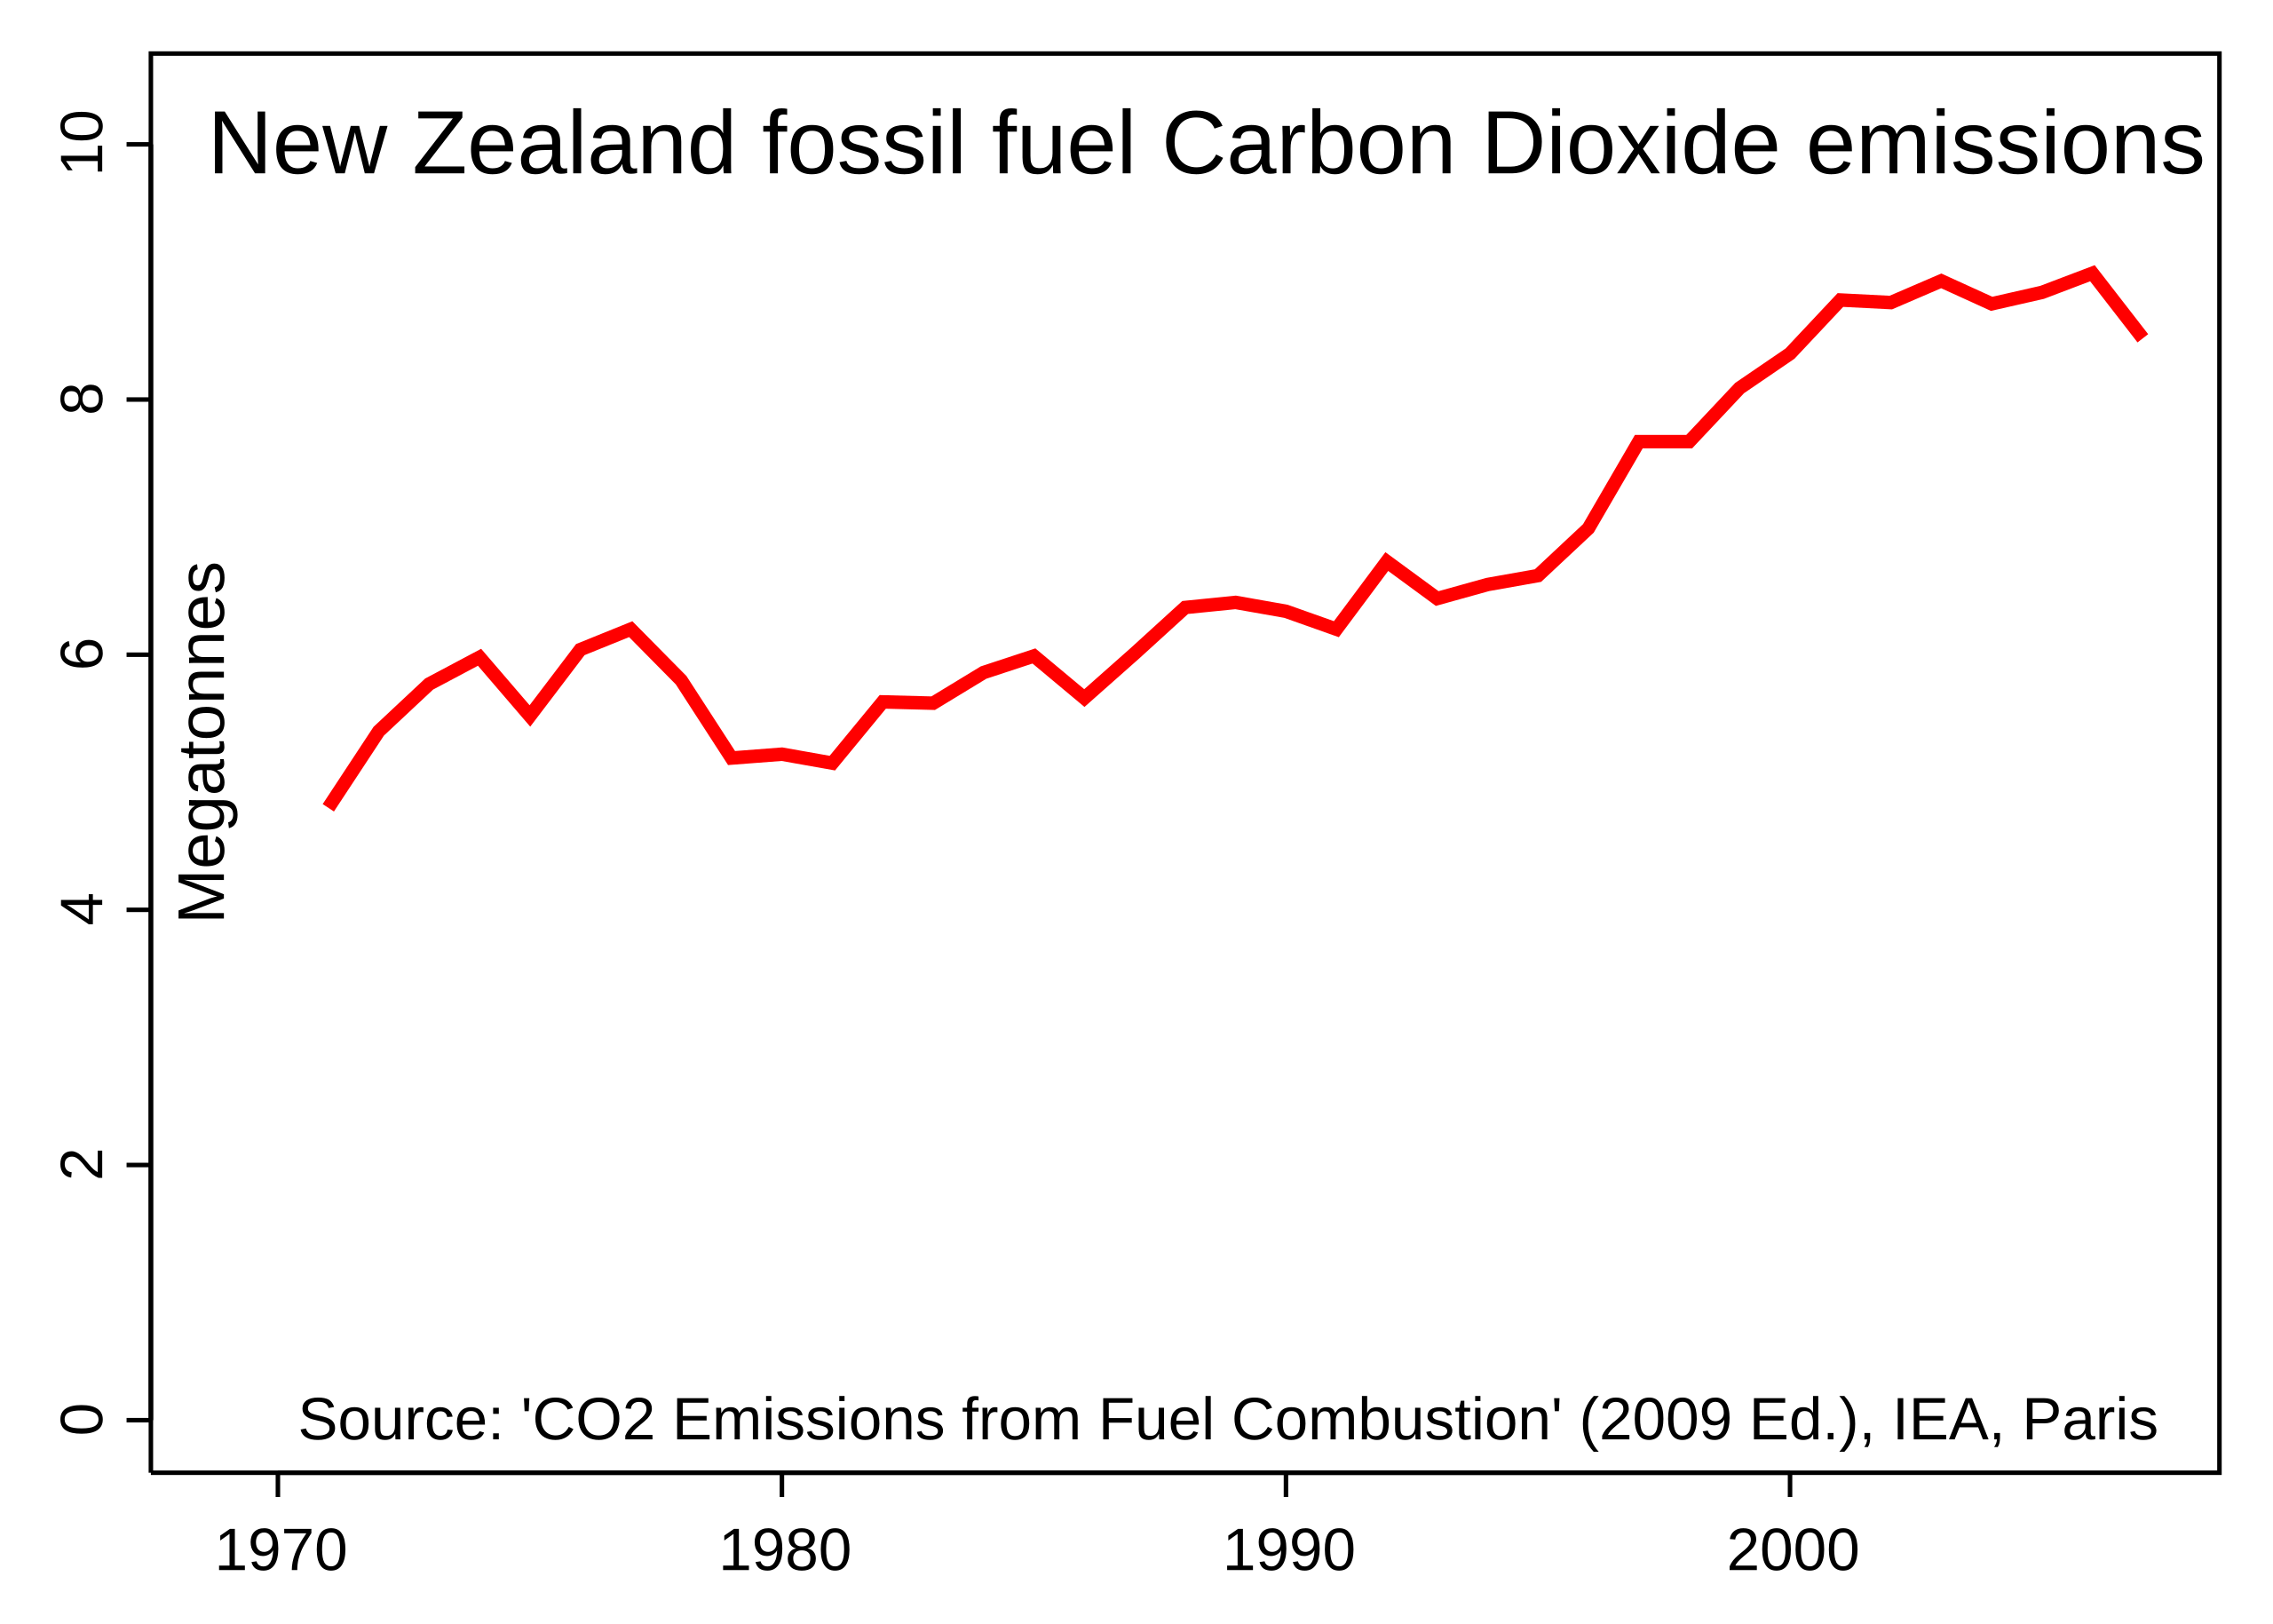
English: New Zealand emissions of Carbon Dioxide in megatonnes 1970 to 2007. |
| Date | |
| Source | Own work Data source: CO2 Emissions from Fuel Combustion (2009 Edition), IEA, Paris. http://www.iea.org/co2highlights/co2highlights.xls |
| Author | Mrfebruary |
R script
[edit]
co2pc <- c(4.80,5.40,5.77,5.98,5.52,6.04,6.20,5.80,5.19,5.22,5.15,5.63,5.62,5.86,5.99,5.66 ,6.01,6.37,6.41,6.34,6.20,6.73,6.44,6.55,6.62,6.99,7.67,7.67, 8.09, 8.36, 8.78,8.76,8.93,8.75,8.84, 8.99,8.48)
years <-c(1971:2007)
library("RSVGTipsDevice")
devSVGTips(file="nzpcapco2.svg",toolTipMode=0,width=7,height=5)
par(mar=c(3,3,1,1)+0.1)
plot(years,co2pc,ylim=c(0,10.3),xlim=c(1969,2007),ann=FALSE, type="n",xlab="",ylab="")
lines(years,co2pc,col=2,lwd=3)
mtext(side=2,cex=1,line=-1.5,"Megatonnes")
mtext(side=3,cex=1.5, line=-2,"New Zealand emissions of CO2 from fossil fuels")
mtext(side=1,cex=0.9, line=-1.5,"Source: 'CO2 Emissions from Fuel Combustion' (2009 Ed.), IEA, Paris")
dev.off()
Licensing
[edit]
- You are free:
- to share – to copy, distribute and transmit the work
- to remix – to adapt the work
- Under the following conditions:
- attribution – You must give appropriate credit, provide a link to the license, and indicate if changes were made. You may do so in any reasonable manner, but not in any way that suggests the licensor endorses you or your use.
- share alike – If you remix, transform, or build upon the material, you must distribute your contributions under the same or compatible license as the original.

|
Permission is granted to copy, distribute and/or modify this document under the terms of the GNU Free Documentation License, Version 1.2 or any later version published by the Free Software Foundation; with no Invariant Sections, no Front-Cover Texts, and no Back-Cover Texts. A copy of the license is included in the section entitled GNU Free Documentation License. |
File history
Click on a date/time to view the file as it appeared at that time.
| Date/Time | Thumbnail | Dimensions | User | Comment | |
|---|---|---|---|---|---|
| current | 01:26, 6 February 2011 | | 506 × 361 (5 KB) | Mrfebruary (talk | contribs) | {{Information |Description ={{en|1=ew Zealand emissions of Carbon Dioxide per capita 1970 to 2006 compared to United Kingdom, Europe, World average, Africa and China. }} |Source ={{own}} Data source: Energy Information Administration Internatio |
You cannot overwrite this file.
File usage on Commons
There are no pages that use this file.