Category:Unspec SVG created with R
Jump to navigation
Jump to search
Media in category "Unspec SVG created with R"
The following 161 files are in this category, out of 161 total.
-
 Dates d'éclosion du marronnier officiel de Genève.svg 648 × 324; 203 KB
-
-
 Classietaperugia.svg 360 × 360; 13 KB
-
 Circle area Monte Carlo integration2.svg 723 × 723; 188 KB
-
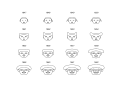
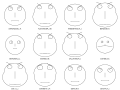 Chernoff faces for evaluations of US judges.svg 720 × 540; 148 KB
-
 COVID-19 cases in Minnesota, 04-13-2020 to 05-06-2020.svg 512 × 410; 75 KB
-
 CAPM-SML.svg 723 × 578; 11 KB
-
 Ticketverkäufe Freiburg Hauptbahnhof 1900-1988.svg 900 × 630; 47 KB
-
 Ticketverkäufe Freiburg Hauptbahnhof 1900–1935.svg 850 × 508; 82 KB
-
 Ticketverkäufe Freiburg Hauptbahnhof 1978–1988.svg 900 × 630; 33 KB
-
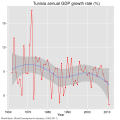 GDP PIB tunisia.svg 630 × 630; 35 KB
-
 GDPcurrent.svg 630 × 630; 37 KB
-
 R-Dunn gender barchart.svg 225 × 450; 60 KB
-
 R-horsekick totals-stackline.svg 360 × 225; 87 KB
-

-
 Rk errors.svg 630 × 630; 44 KB
-
 Runge-kutta.svg 720 × 450; 54 KB
-
 Hammersley set 2D.svg 289 × 289; 37 KB
-
 Boxplot of Average Article Feedback ratings by project rated quality.svg 796 × 564; 258 KB
-
 Levene example.svg 900 × 450; 111 KB
-
 Zinsstrukturkurven 2013.svg 630 × 540; 29 KB
-
 Bostonh hetres Heroskedastische Residuen.svg 450 × 450; 122 KB
-
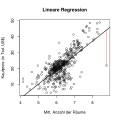 Bostonh hetres Lineare Regression.svg 450 × 450; 122 KB
-
 Bostonh hetres.svg 900 × 450; 347 KB
-
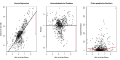 Bostonh sqhetres.svg 900 × 450; 514 KB
-
 NZ sector ghg 1990 2007.svg 578 × 434; 26 KB
-
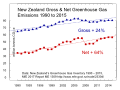 NZ-ghg-2015.svg 720 × 540; 122 KB
-
 Nzghg gases red-7 6-07.svg 506 × 434; 5 KB
-
 New Zealand per capita co2 comparisons.svg 506 × 361; 5 KB
-
-
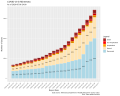
 Article Feedback number of articles by rating count.svg 900 × 564; 381 KB
-

-
 Lastprofil EWE Frühjahr mit Kraftwerkseinsatz schematisch.svg 900 × 720; 129 KB
-
 WSPR 2014.svg 540 × 450; 136 KB
-
 Dämmstoffabsatz.svg 630 × 630; 59 KB
-
 NZ-best-land-temp-anom.svg 720 × 540; 137 KB
-
 ISE-100 Index.svg 900 × 630; 203 KB
-
 Hu real gdp growth.svg 867 × 578; 7 KB
-
 Lt real gdp growth.svg 867 × 723; 8 KB
-
 Lv real gdp growth.svg 1,084 × 867; 8 KB
-
 Sw real gdp growth.svg 867 × 578; 8 KB
-
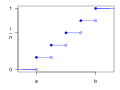 Dis Uniform distribution CDF.svg 360 × 270; 15 KB
-
 R-horsekick totals-histogram+quartiles.svg 360 × 225; 102 KB
-
 R-horsekick totals-histogram.svg 360 × 225; 81 KB
-
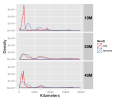
 R-US state areas-histogram hires+points.svg 360 × 225; 95 KB
-
 R-US state areas-histogram hires.svg 360 × 225; 69 KB
-
 R-US state areas-histogram+points.svg 360 × 225; 92 KB
-
 R-US state areas-histogram.svg 360 × 225; 66 KB
-
 Runge-Kutta slopes.svg 630 × 630; 31 KB
-
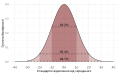 Standard Normal Distribution uk.svg 512 × 316; 24 KB
-
 Log-log plot example.svg 360 × 360; 6 KB
-
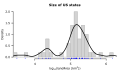 R-US state areas-hist+dens log.svg 450 × 270; 84 KB
-
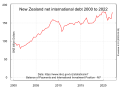 New Zealand overseas debt 1993-2010.svg 720 × 540; 91 KB
-
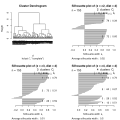
 Ruwiki elections 2017 2020 wardD2 vs D clusterization.svg 1,350 × 5,400; 1.77 MB
-
 Simpson's paradox continuous.svg 390 × 260; 18 KB
-
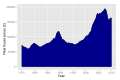 UK real house prices 1975-2010.svg 540 × 360; 73 KB
-
 Operating system usage share.svg 630 × 630; 47 KB
-
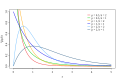
 Weibull PDF.svg 540 × 540; 112 KB
-
 United States farm subsidies (source ewg.org).svg 540 × 540; 60 KB
-
 Fin unemployment.svg 1,084 × 867; 11 KB
-
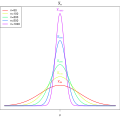
 Shapiro-Wilk Simulated CDF for n = 5, 10, 15, ..., 50.svg 960 × 675; 499 KB
-
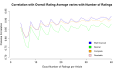
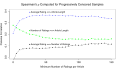 Spearman correlation coefficient plot for article feedback data.svg 960 × 564; 135 KB
-
 Simple Massachusetts Vector.svg 960 × 564; 6 KB
-

-
 Ticketverkäufe Freiburg Hauptbahnhof 1900–1935 b.svg 900 × 630; 45 KB
-
 Ticketverkäufe Freiburg Hauptbahnhof 1978-1988 b.svg 900 × 630; 29 KB
-
 DelaporteCDF.svg 515 × 421; 37 KB
-
 Slope quadrant comma.svg 540 × 540; 263 KB
-
 Slope quadrant.svg 540 × 540; 260 KB
-
 Horsekick cdf groupeddata.svg 360 × 360; 39 KB
-
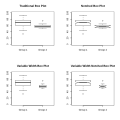 Fourboxplots.svg 630 × 630; 42 KB
-
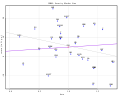
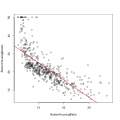 ScatterLstatMedv.svg 630 × 630; 183 KB
-
 Non-Chernoff faces - Longley data.svg 720 × 540; 216 KB
-
 Euler two steps.svg 630 × 630; 16 KB
-
 Stuttgart Airport passengers de.svg 1,427 × 696; 19 KB
-
 Elements of a boxplot.svg 354 × 141; 33 KB
-
 Euler stiffness.svg 630 × 630; 26 KB
-
 Fstest.svg 450 × 360; 25 KB
-
 Icp-switch.svg 578 × 434; 19 KB
-
 R-horsekick totals-1D size.svg 135 × 450; 69 KB
-
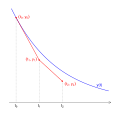
 Extrapolation.svg 630 × 630; 13 KB
-
 R-horsekick totals-1D jitter.svg 135 × 450; 70 KB
-
 R-Titanic passengers.svg 225 × 450; 60 KB
-
 R-US state areas-1D.svg 450 × 135; 95 KB
-
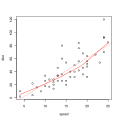 R-car stopping distances 1920-plain.svg 360 × 360; 44 KB
-
 R-horsekick totals-1D stack.svg 135 × 450; 70 KB
-
 R-horsekick totals-quantileplot+quartiles.svg 360 × 360; 99 KB
-
 Distance Correlation Examples.svg 506 × 318; 1.02 MB
-
 EmpiricalQuantiles.svg 630 × 630; 104 KB
-
 J-shaped density.svg 629 × 629; 19 KB
-
 Norrington Table.svg 1,219 × 703; 877 KB
-
 R-car stopping distances 1920+lowess.svg 720 × 360; 106 KB
-
 R-horsekick totals-quantileplot.svg 360 × 360; 80 KB
-
 R-US state areas-1D sqrt+extras.svg 450 × 135; 96 KB
-
 R-horsekick totals-by year.svg 360 × 360; 80 KB
-
 ResidualsForGQTest.svg 630 × 630; 225 KB
-
 R-car stopping distances 1920+null.svg 720 × 360; 105 KB
-
 R-US state areas-1D log+extras.svg 450 × 135; 97 KB
-
 R-car stopping distances 1920+bootstrap1000.svg 360 × 360; 1.4 MB
-
 R-US state areas-1D log.svg 450 × 135; 62 KB
-
 Distribution of mean estimator.svg 630 × 630; 103 KB
-
 Martingale1.svg 630 × 630; 23 KB
-
 R-horsekick totals-boxplot.svg 135 × 450; 66 KB
-
 R-horsekick totals-ecdf.svg 360 × 360; 86 KB
-
 Inflation Yen USD 1971-2009 de.svg 1,010 × 421; 71 KB
-
 ScagnosticsBase.svg 900 × 270; 639 KB
-
 Supply and Demand.svg 512 × 381; 9 KB
-
 J-shaped density - corresponding distribution.svg 629 × 629; 19 KB
-
 Maximum likelihood poisson.svg 630 × 630; 22 KB
-
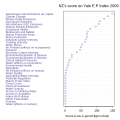 NewZealand score YaleEnvironmentalProtectionIndex.svg 578 × 578; 18 KB
-
 R-car stopping distances 1920.svg 360 × 360; 82 KB
-
 Ruwiki arbcom and admin elections 2017 2020 wardD2 clusterization.svg 3,600 × 578; 593 KB
-
 R-US state areas-1D jitter.svg 450 × 135; 97 KB
-
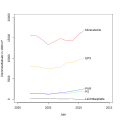
 Usage share of alternative web browsers (Source Stat Counter).svg 630 × 630; 55 KB
-
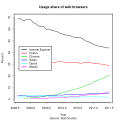 Usage share of web browsers (Source Stat Counter).svg 630 × 630; 57 KB
-
 R-US state areas-1D sqrt.svg 450 × 135; 78 KB
-
 R-US state areas-quantile sqrt.svg 360 × 360; 132 KB
-
 R-car stopping distances 1920+linear-resids.svg 360 × 360; 56 KB
-
 R-basic cars plot example.svg 360 × 360; 109 KB
-
 R-car stopping distances 1920+linear.svg 720 × 360; 105 KB
-
 R-car stopping distances 1920+null-resids.svg 360 × 360; 56 KB
-
 R-car stopping distances 1920+quadratic.svg 720 × 360; 107 KB
-
 R-US state areas-1D+quartiles.svg 450 × 135; 97 KB
-
 R-US state areas-quantile log.svg 360 × 360; 133 KB
-
 GermanPopulation 1970 2009.svg 450 × 900; 219 KB
-
 Dotplot-example.svg 720 × 720; 138 KB
-
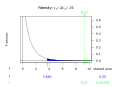 F-dens-2-15df.svg 800 × 578; 65 KB
-
 Kalkdünger2014.svg 630 × 630; 46 KB
-
 LevyDichteF.svg 723 × 578; 16 KB
-
 Mmobile.svg 594 × 522; 16 KB
-
 Weibull CDF.svg 540 × 540; 113 KB
-
 GewichtLebenstag.svg 450 × 360; 56 KB
-
 Graph comparing recent changes on Wikivoyage and Wikitravel.svg 585 × 405; 78 KB
-
 IncomeInequality.svg 630 × 450; 112 KB
-
 IncomeInequality7.svg 630 × 630; 116 KB
-
 IncomeInequality8square.svg 630 × 630; 112 KB
-
 Iris silhouette.svg 630 × 630; 325 KB
-
 One sample ttest.svg 900 × 180; 31 KB
-
 ParallelCoordinatePattern.svg 900 × 360; 116 KB
-
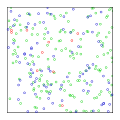 Pseudorandom sequence 2D.svg 289 × 289; 37 KB
-
 Swiss kmeans.svg 630 × 630; 107 KB
-
 TrendSaisonModell.svg 900 × 630; 166 KB
-
 ZentralesSchwankungsintervall.svg 630 × 630; 48 KB
-
 GammaDichteF.svg 650 × 434; 18 KB
-
 GammaVerteilungF.svg 650 × 434; 15 KB
-
 Simpson's paradox.svg 500 × 346; 9 KB
-
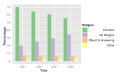 Religious affiliation in New Zealand 1991-2006 - bar chart.svg 504 × 315; 59 KB
-
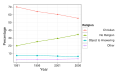 Religious affiliation in New Zealand 1991-2006.svg 504 × 315; 60 KB
-
 Reg ls dgr qq resid t edat pad.svg 630 × 630; 65 KB
-
 Reg ls dgr resid ajust.svg 630 × 630; 77 KB
-
 Reg ls dgr resid t ajust.svg 630 × 630; 69 KB
-
 Reg ls dgr resid x.svg 630 × 630; 47 KB
-
 Reg ls dgr resid x2.svg 630 × 630; 52 KB
-
 Reg ls heteroscedasticitat.svg 630 × 630; 83 KB
-
 Reg ls homoc.svg 630 × 630; 46 KB
-
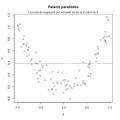 Reg ls parabolica.svg 630 × 630; 67 KB
-
 Reg ls sinusoidal.svg 630 × 630; 81 KB
-
 Regressió lineal simple del pes del nadó i PCB.svg 630 × 630; 41 KB
-
 Regressió lineal simple relació positiva.svg 630 × 630; 60 KB
-
 Regressió lineal simple.svg 630 × 630; 23 KB
-
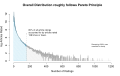
 Power law illustration for Article Feedback ratings.svg 900 × 564; 67 KB


.svg)


.svg)
.svg)


