File:Maps of projected changes in Northern Hemisphere seasonal mean surface air temperature from the late 20th century to the mid-21st century, based on SRES emissions scenario A1B.png
Jump to navigation
Jump to search
Size of this preview: 800 × 500 pixels. Other resolutions: 320 × 200 pixels | 640 × 400 pixels | 1,024 × 640 pixels | 1,280 × 800 pixels | 3,200 × 2,000 pixels.
Original file (3,200 × 2,000 pixels, file size: 929 KB, MIME type: image/png)
Captions
Captions
Add a one-line explanation of what this file represents
Summary
[edit]
| Description |
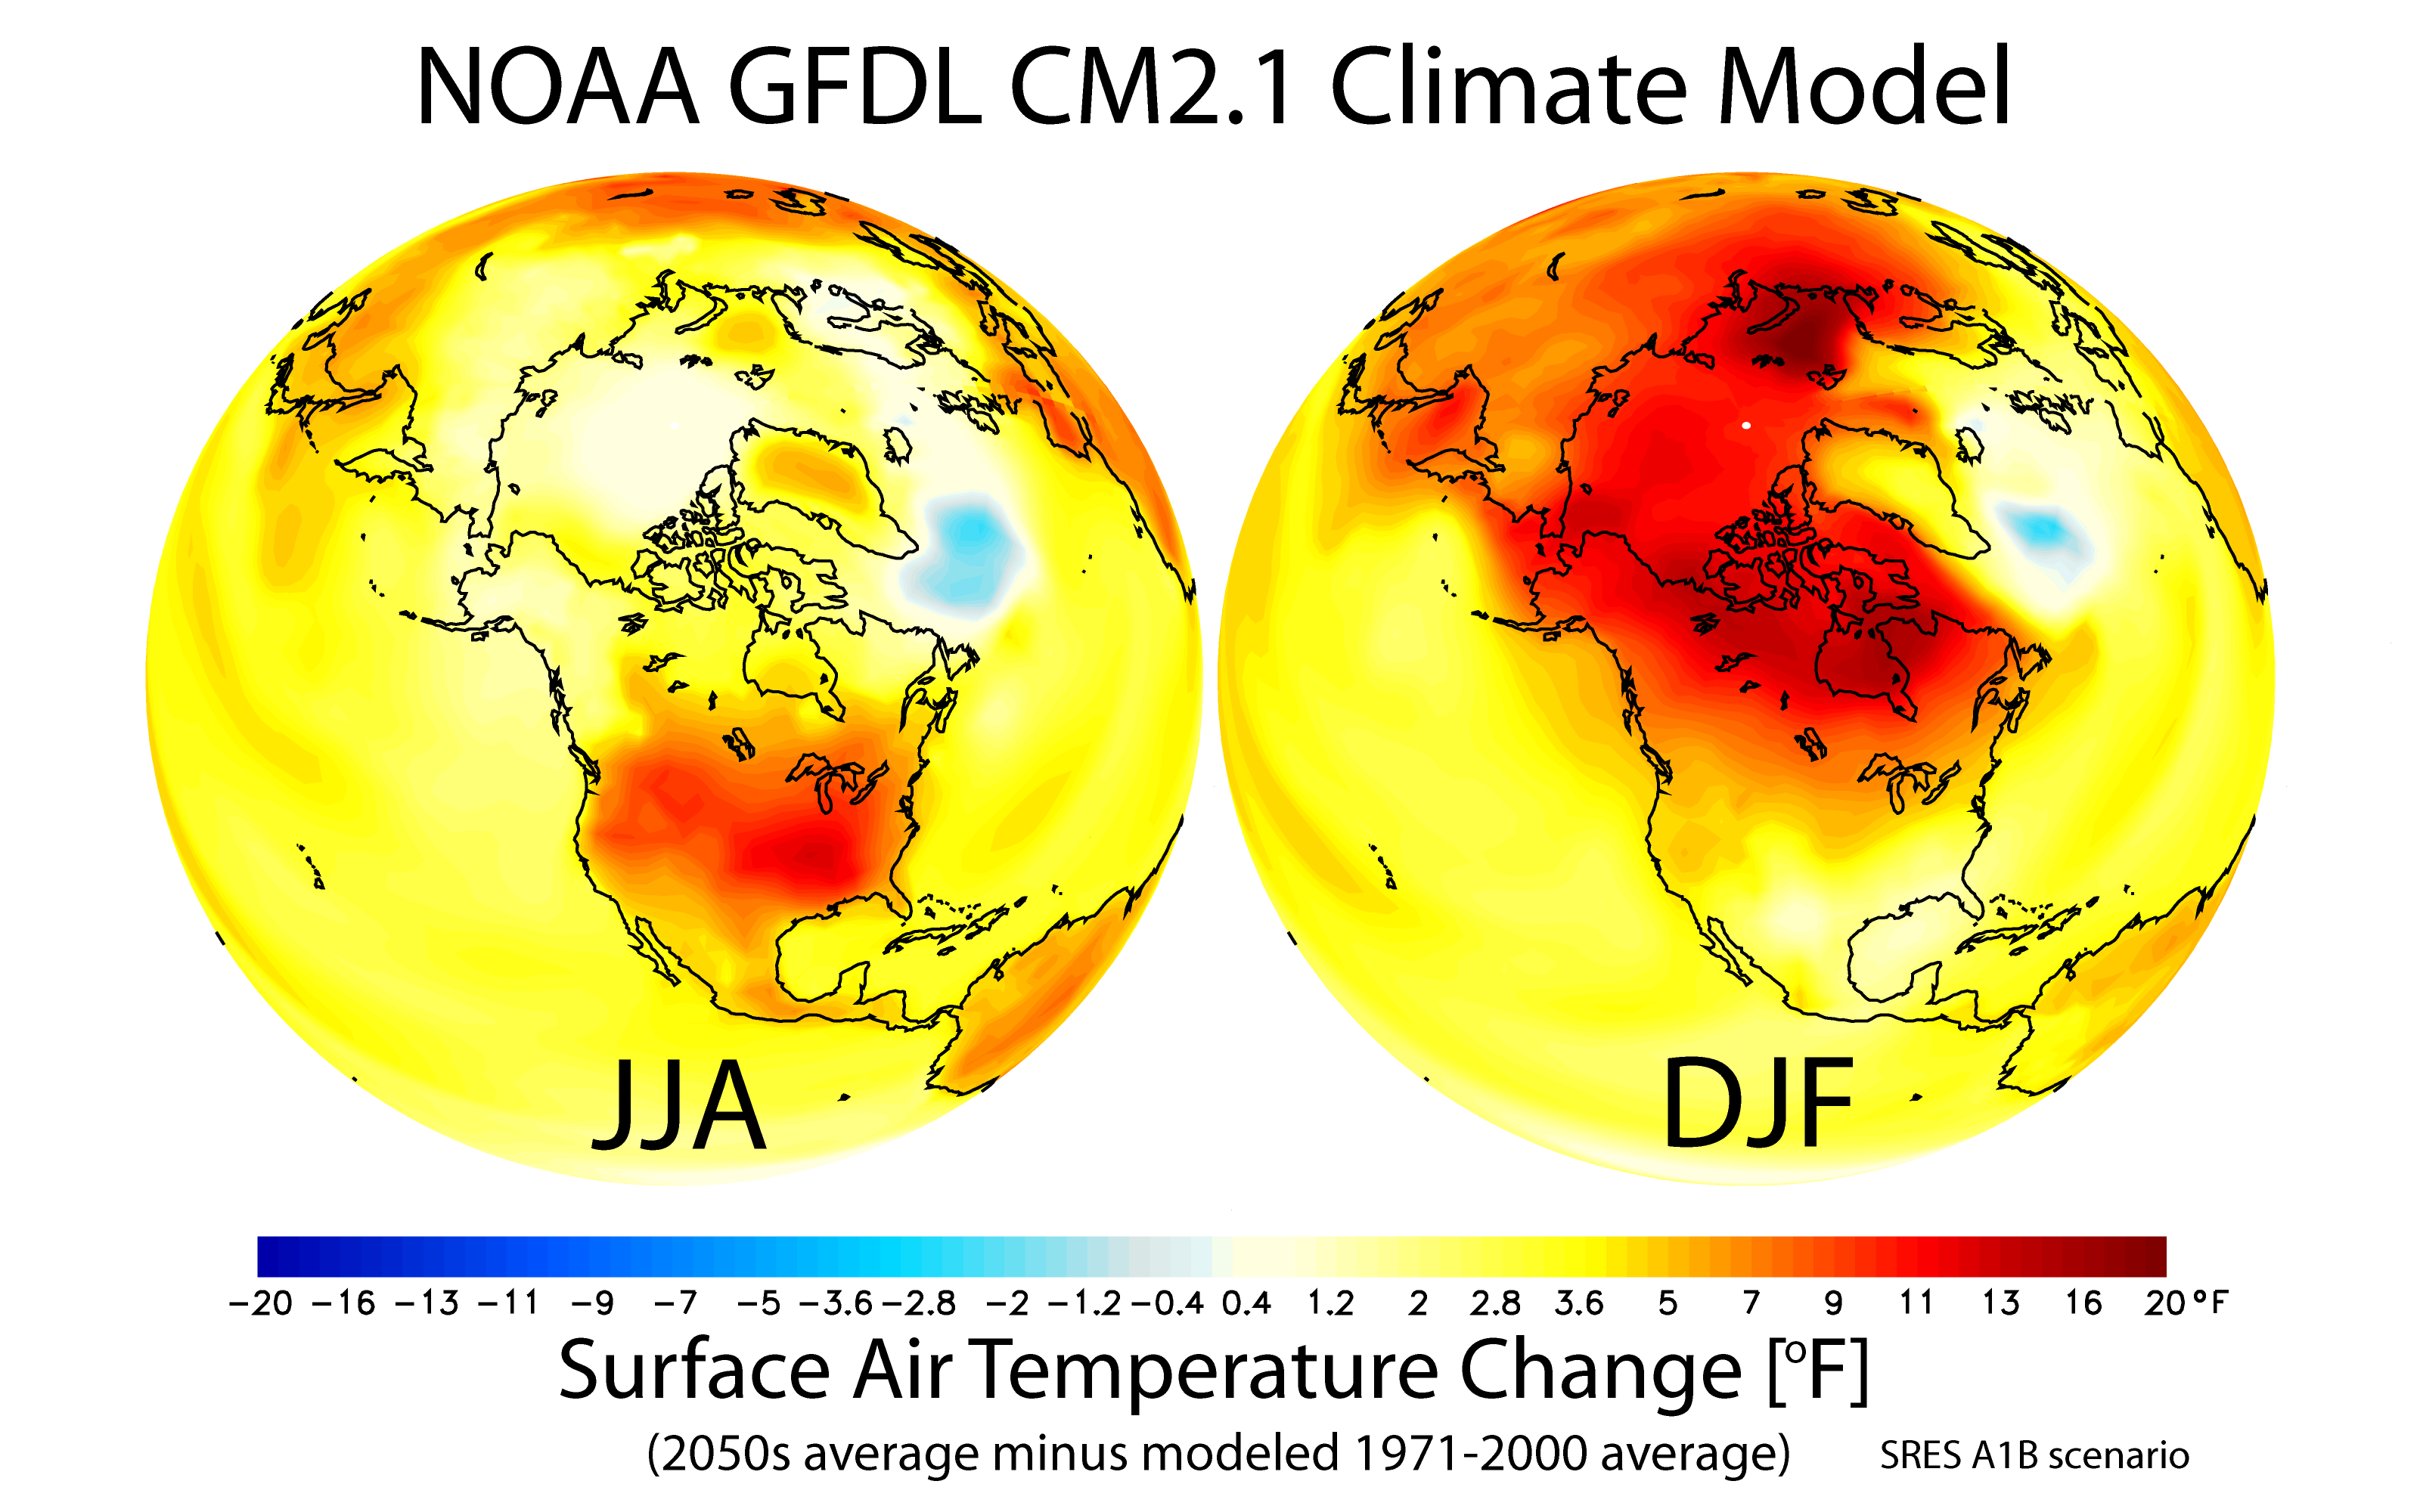
English: Description is based on NOAA (2007) public-domain source: GFDL CM2.1 model-simulated change in seasonal mean surface air temperature from the late 20th century (1971-2000 average) to the middle 21st century (2051-2060). The left panel shows changes for June July August (JJA) seasonal averages, and the right panel shows changes for December January February (DJF). The change is in response to increasing atmospheric concentrations of greenhouse gases and aerosols based on a "middle of the road" estimate of future emissions. Future emissions are based on the "A1B" emissions scenario, taken from the Special Report on Emissions Scenarios. Warming is projected to be larger over continents than oceans, and is largest at high latitudes of the Northern Hemisphere during Northern Hemisphere winter (DJF). The term “global warming” is commonly used to refer to surface air temperature changes that are a response to increasing atmospheric greenhouse gas (GHG) concentrations. However, the warming is not expected to be uniform over the globe, nor is it expected to be the same during all seasons of the year. Computer model simulations conducted at NOAA’s Geophysical Fluid Dynamics Laboratory (GFDL) and elsewhere project that GHG induced warming will be more rapid over land masses than over oceans. In the image, red colors indicate greater warming over the continents. White and blue-green colors mark areas with the least warming or slight cooling, found mostly over oceans. Additionally, the greatest warming is expected during the winter over northern North America and north-central Asia. The map on the left of summer (June, July, August JJA) temperatures projects warming of around +1 to +3 °F over most ocean areas, and +1 to +9 over most land areas. The map on the right of winter (December, January, February DJF) temperatures projects greatest warming at polar latitudes, of around +9 to +16 °F. The DJF map also shows warming of around 0 to +3 °F over most of the Pacific and Atlantic oceans. References: NOAA, January 2007: GFDL Climate Modeling Research Highlights: Patterns of greenhouse warming (PDF), vol. 1, no. 6, revision 2/2/2007, 8:50.08 AM. The National Oceanic and Atmospheric Administration (NOAA) Geophysical Fluid Dynamics Laboratory (GFDL) - Princeton, NJ, USA |
| Date | |
| Source | Very High Resolution Version 3200 x 2000 png (929KB), in: NOAA GFDL Climate Research Highlights Image Gallery: Patterns of Greenhouse Warming, publisher: NOAA GFDL. Retrieved 2012-10-13. |
| Author | NOAA Geophysical Fluid Dynamics Laboratory (GFDL) |
| Permission (Reusing this file) |
From cited the cited source: "The materials presented here help illustrate some of the key research results that GFDL scientists have reported on recently. These graphics are considered to be in the public domain, and thus can be downloaded freely. We do request that if these images are used in publications or media broadcasts credit be given to "NOAA Geophysical Fluid Dynamics Laboratory" or at least "NOAA GFDL"." |
Licensing
[edit]
This image is in the public domain because it contains materials that originally came from the U.S. National Oceanic and Atmospheric Administration, taken or made as part of an employee's official duties.
|
File history
Click on a date/time to view the file as it appeared at that time.
| Date/Time | Thumbnail | Dimensions | User | Comment | |
|---|---|---|---|---|---|
| current | 03:13, 17 October 2012 | | 3,200 × 2,000 (929 KB) | Enescot (talk | contribs) | {{Information |Description ={{en|1=Description is based on NOAA (2007) public-domain source: GFDL CM2.1 model-simulated change in seasonal mean surface air temperature from t... |
You cannot overwrite this file.
File usage on Commons
There are no pages that use this file.
File usage on other wikis
The following other wikis use this file:
- Usage on pt.wikipedia.org