File:Maiztasun metatuak ojibak05.pdf

Original file (1,800 × 750 pixels, file size: 5 KB, MIME type: application/pdf)
Captions
Captions
Summary
[edit]| Description |
English: Cumulative fre polygon
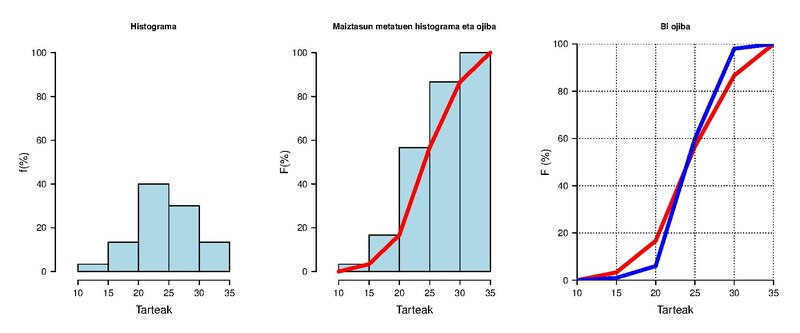
x=c(20.30975,18.19873,28.53423,25.76547,28.98363,22.13357,24.71114,24.53094,12.28666,24.73473,21.88932,25.88932,31.14394,19.50850,21.93942,31.35156,23.43202,26.73680,18.24004,16.78666,26.45836,23.22566,20.82735,27.54200,32.96702,20.84085,33.86712,23.63435,26.76314,27.63858) tarte=seq(10,35,by=5) hist(x,breaks=tarte,plot=F) #Histogramaren zenbakizko informazioa eskuratu tarteak=hist(x,plot=F)$breaks #Tarteak soilik eskuratu maizta=hist(x,plot=F)$counts #Maiztasun absolutuak soilik eskuratu maizte=(maizta/30)*100 #Maiztasun erlatiboak kalkulatu maizta maizte maiztemet=cumsum(maizte) #Maiztasun erlatibo metatuak kalkulatu maiztemet pdf("liburua_2_grafikoak_ojibak05.pdf",width=12,height=5) par(mar=c(5,5.3,4,2),oma=c(1,1,1,1)) #Irudiko marjin egokiak zehaztu par(mfrow=c(1,3)) #Hiru grafiko irudi berean (hiru zutabe, errenkada bat) library(agricolae) graph.freq(tarteak,counts=maizte,las=1,ylim=c(0,100),axes=F,cex.main=1.1,cex.lab=1.5,cex.axis=1.3,main="Histograma",col=c("lightblue"),xlab="Tarteak",ylab="f(%)") #Maiztasun bakunen histograma axis(2,at=c(0,20,40,60,80,100),las=1,cex.axis=1.3) axis(1,at=seq(10,35,by=5),las=1,cex.axis=1.3) maiztemet=cumsum(maizte) #Maiztasun metatu erlatiboak kalkulatu graph.freq(tarteak,counts=maiztemet,axes=F,ylim=c(0,100),las=1,cex.axis=1.3,cex.main=1.1,cex.lab=1.5,cex.axis=1.3,main="Maiztasun metatuen histograma eta ojiba",col=c("lightblue"),xlab="Tarteak",ylab="F(%)") #Maiztasun metatuen histograma axis(2,at=c(0,20,40,60,80,100),las=1,cex.axis=1.3) axis(1,at=seq(10,35,by=5),las=1,cex.axis=1.3) maiztemet=c(0,maiztemet) #Maiztasun erlatiboei 0 gaineratu maiztemety=c(0,1,6,60,98,100) lines(tarteak,maiztemet,col=c("red"),lwd=5) #Gainean ojiba marraztu. par(bty="l") plot(tarteak,maiztemet,col=c("red"),xaxs="i",yaxs="i",lwd=5,cex.axis=1.3,cex.main=1.1,main="Bi ojiba",cex.lab=1.5,cex.axis=1.3,las=1,ylim=c(0,100),type="l",ylab="F (%)",xlab="Tarteak",yaxt="n") axis(2,at=c(0,20,40,60,80,100),las=1,cex.axis=1.3) lines(tarteak,maiztemety,col=c("blue"),lwd=5) #Gainean ojiba marraztu. abline(v=seq(10,35,by=5),lty=3,lwd=1) abline(h=seq(0,100,by=20),lty=3,lwd=1) dev.off() |
| Date | |
| Source | Own work |
| Author | Joxemai |
Licensing
[edit]- You are free:
- to share – to copy, distribute and transmit the work
- to remix – to adapt the work
- Under the following conditions:
- attribution – You must give appropriate credit, provide a link to the license, and indicate if changes were made. You may do so in any reasonable manner, but not in any way that suggests the licensor endorses you or your use.
- share alike – If you remix, transform, or build upon the material, you must distribute your contributions under the same or compatible license as the original.
File history
Click on a date/time to view the file as it appeared at that time.
| Date/Time | Thumbnail | Dimensions | User | Comment | |
|---|---|---|---|---|---|
| current | 07:46, 13 May 2017 |  | 1,800 × 750 (5 KB) | Joxemai (talk | contribs) | User created page with UploadWizard |
You cannot overwrite this file.
File usage on Commons
There are no pages that use this file.