File:Interquartile Range Graph.JPG
Jump to navigation
Jump to search
No higher resolution available.
Interquartile_Range_Graph.JPG (659 × 574 pixels, file size: 54 KB, MIME type: image/jpeg)
Captions
Captions
Add a one-line explanation of what this file represents

|
This graph image could be re-created using vector graphics as an SVG file. This has several advantages; see Commons:Media for cleanup for more information. If an SVG form of this image is available, please upload it and afterwards replace this template with
{{vector version available|new image name}}.
It is recommended to name the SVG file “Interquartile Range Graph.svg”—then the template Vector version available (or Vva) does not need the new image name parameter. |


Summary
[edit]
| Description |
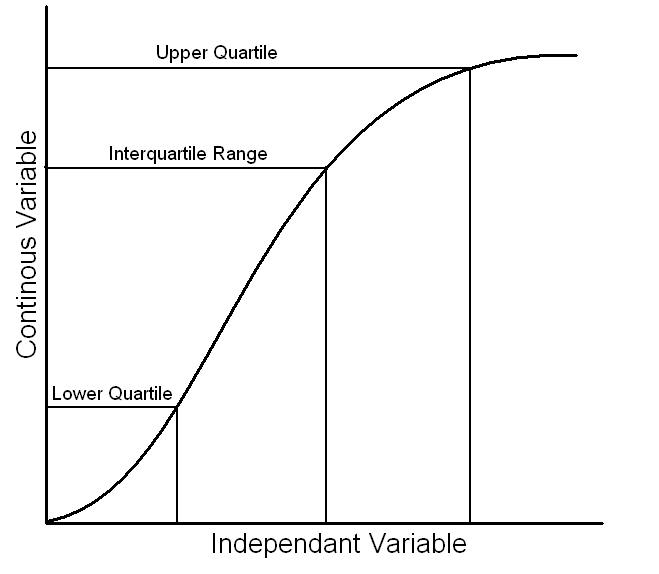
English: This file is to ilistrate how the interquartile range can be found using the upper quartile and the lower quartile. It's lines do not have complete accuracy but show how the upper quartile is 3/4 and the lower quartile is 1/4. Do not think that this means the interquartile range is 2/4 (or 1/2) as this is not the case. |
| Date | |
| Source | Own work |
| Author | Kittsville |
Licensing
[edit]
| I, the copyright holder of this work, release this work into the public domain. This applies worldwide. In some countries this may not be legally possible; if so: I grant anyone the right to use this work for any purpose, without any conditions, unless such conditions are required by law. |
File history
Click on a date/time to view the file as it appeared at that time.
| Date/Time | Thumbnail | Dimensions | User | Comment | |
|---|---|---|---|---|---|
| current | 11:47, 7 June 2009 | | 659 × 574 (54 KB) | Kittsville (talk | contribs) | {{Information |Description={{en|1=This file is to ilistrate how the interquartile range can be found using the upper quartile and the lower quartile. It's lines do not have complete accuracy but show how the upper quartile is 3/4 and the lower quartile is |
You cannot overwrite this file.
File usage on Commons
There are no pages that use this file.