Category:Interquartile range
Jump to navigation
Jump to search
measure of statistical dispersion | |||||
| Upload media | |||||
| Spoken text audio | |||||
|---|---|---|---|---|---|
| Instance of |
| ||||
| Subclass of |
| ||||
| Facet of | |||||
| Has use | |||||
| |||||
Media in category "Interquartile range"
The following 16 files are in this category, out of 16 total.
-
Box-Plot mit Interquartilsabstand.png 715 × 536; 17 KB
-
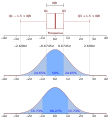
Boxplot vs PDF-be.svg 598 × 652; 492 KB
-
Boxplot vs PDF.png 703 × 731; 9 KB
-
Boxplot vs PDF.svg 598 × 652; 493 KB
-
BoxplotIQ-exc.png 2,464 × 931; 32 KB
-
BoxplotIQ-inc.png 1,772 × 945; 26 KB
-
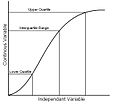
Interquartile Range Graph.JPG 659 × 574; 54 KB
-
IQ - distribuição assimétrica.gif 650 × 469; 405 KB
-
IQ - distribuição simétrica.gif 650 × 468; 409 KB
-
TabelaIQ - Amplitude de classe.png 1,168 × 803; 40 KB
-
TabelaIQ1 - inc.png 638 × 1,397; 35 KB
-
TabelaIQ1.png 652 × 1,397; 35 KB
-
TabelaIQA - exc.png 652 × 1,023; 25 KB
-
TabelaIQA - inc.png 614 × 1,025; 24 KB
-
TabelaIQB - exc.png 652 × 1,025; 25 KB
-
TabelaIQB - inc.png 614 × 1,025; 24 KB


