File:Hot gas giant exoplanet WASP-43 b (MIRI phase curve and temperature map) (WASP43b-2).tiff
Jump to navigation
Jump to search

Size of this PNG preview of this TIF file: 424 × 600 pixels. Other resolutions: 170 × 240 pixels | 339 × 480 pixels | 543 × 768 pixels | 724 × 1,024 pixels | 1,448 × 2,048 pixels | 4,420 × 6,250 pixels.
Original file (4,420 × 6,250 pixels, file size: 7.66 MB, MIME type: image/tiff)
Captions
Captions
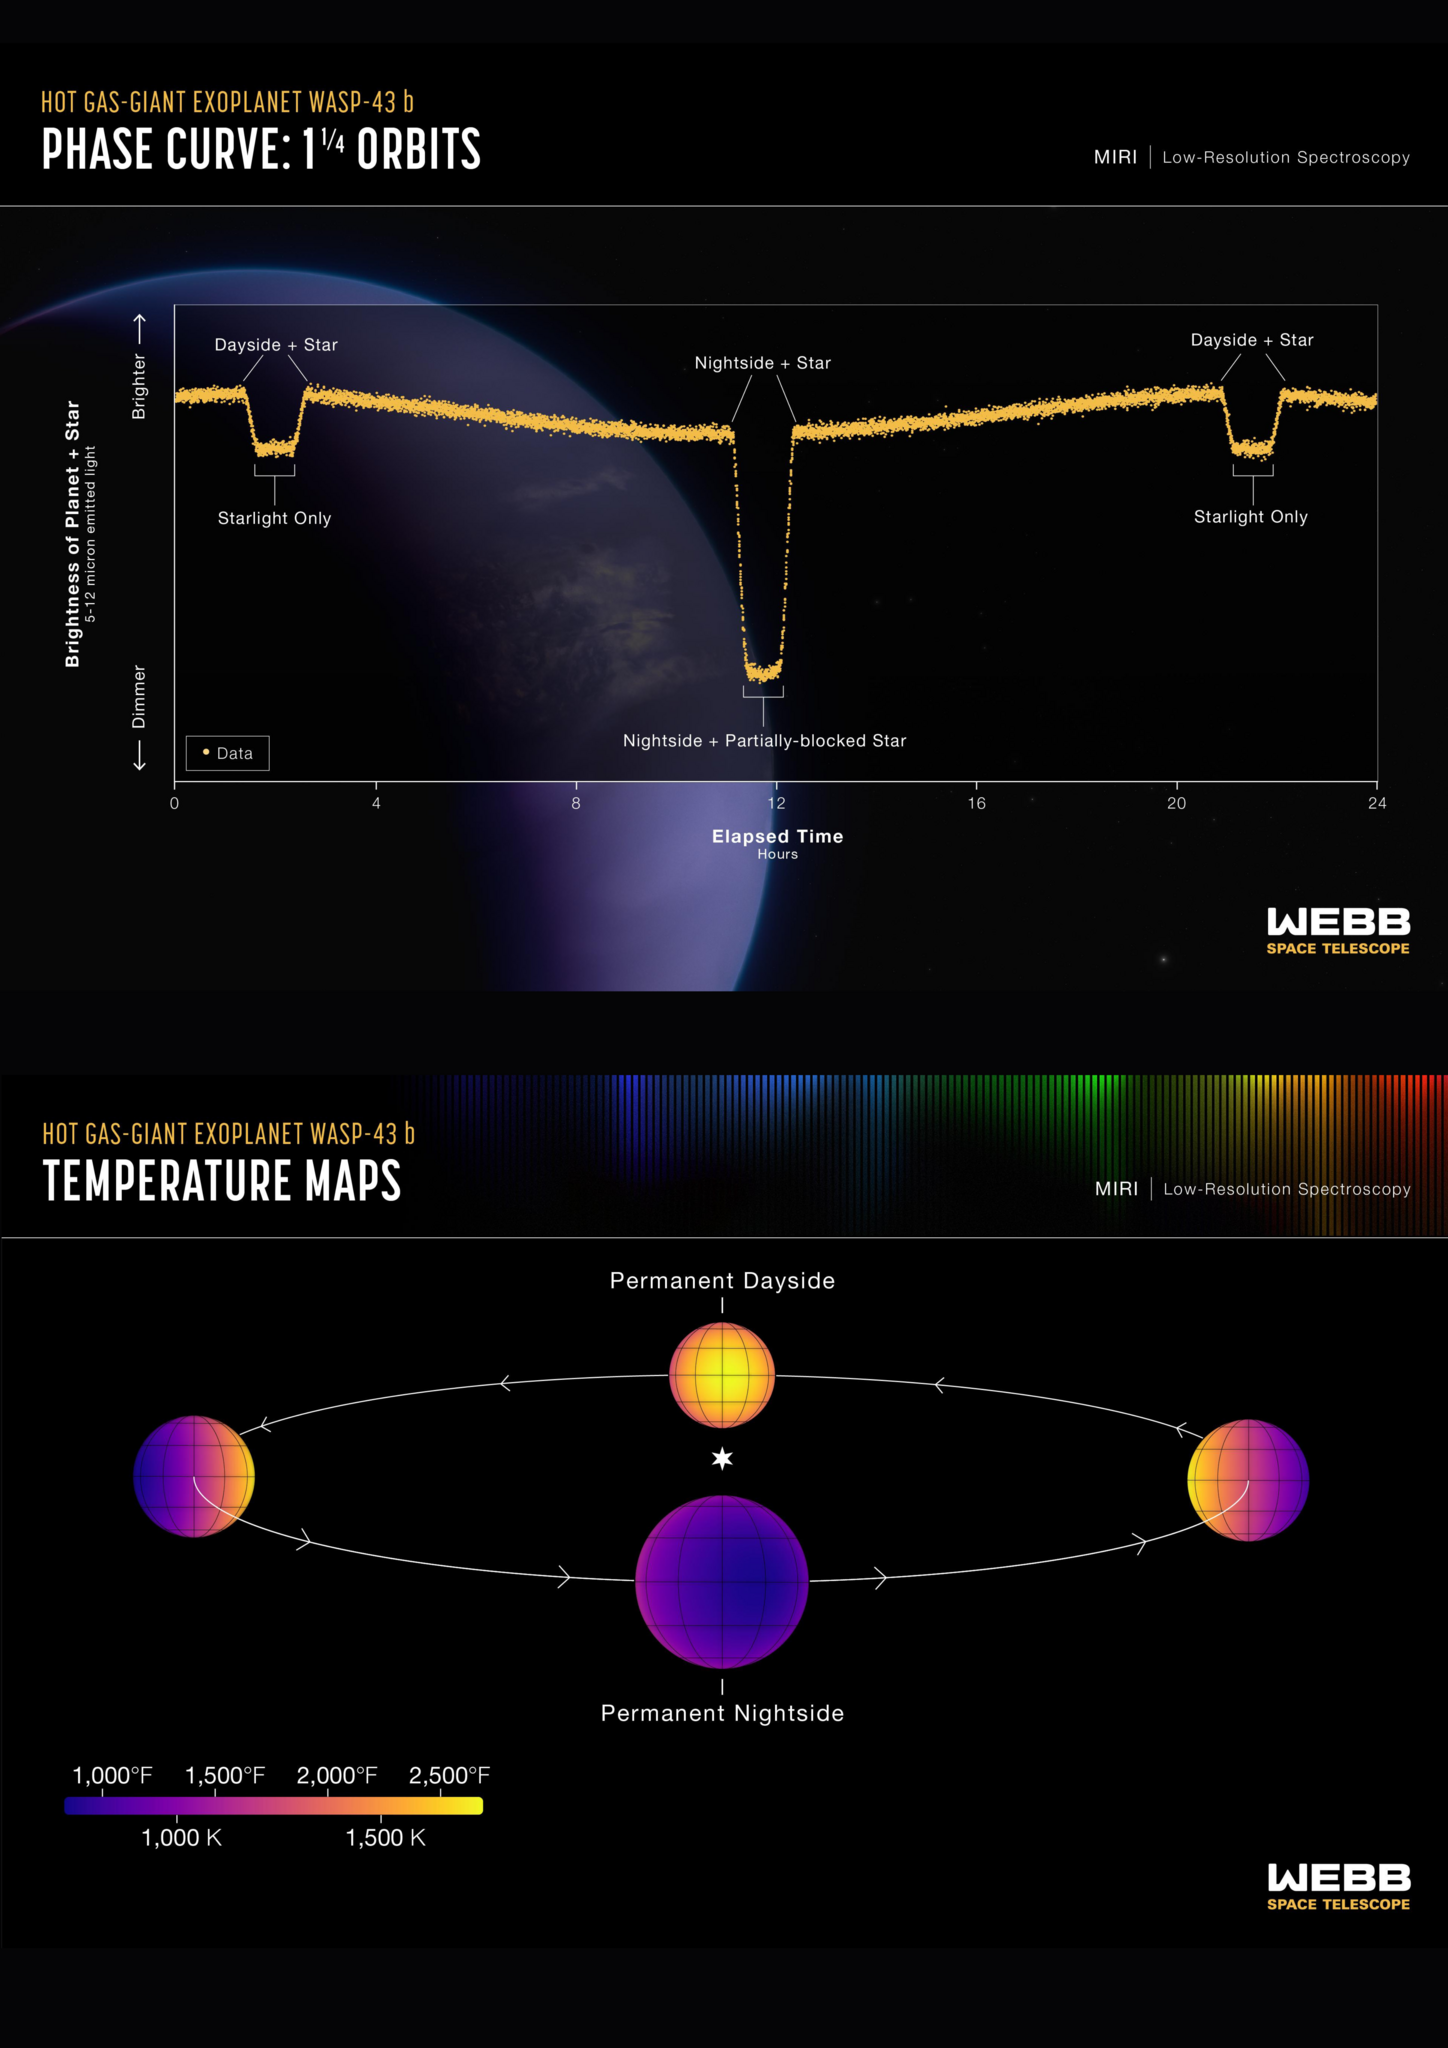
<strong>Top</strong>: This light curve shows the change in brightness of the WASP-43 system over time as the planet orbits the star. This type of light curve is known as a phase curve because it includes the entire orbit, or all phases of the planet.
Summary
[edit]| Description |
English: Top: This light curve shows the change in brightness of the WASP-43 system over time as the planet orbits the star. This type of light curve is known as a phase curve because it includes the entire orbit, or all phases of the planet.Because it is tidally locked, different sides of WASP-43 b rotate into view as it orbits. The system appears brightest when the hot dayside is facing the telescope, just before and after the secondary eclipse when the planet passes behind the star. The system grows dimmer as the planet continues its orbits and the nightside rotates into view. After the transit when the planet passes in front of the star, blocking some of the starlight, the system brightens again as the dayside rotates back into view.This graph shows more than 8,000 measurements of 5- to 12-micron mid-infrared light captured over a single 24-hour observation using the low-resolution spectroscopy mode on Webb’s MIRI (Mid-Infrared Instrument). By subtracting the amount of light contributed by the star, astronomers can calculate the amount coming from the visible side of the planet as it orbits. Webb was able to detect differences in brightness as small as 0.004% (40 parts per million).Since the amount of mid-infrared light given off by an object is directly related to its temperature, astronomers were able to use these measurements to calculate the average temperature of different sides of the planet.Bottom: Temperature maps and graph of average temperature of the visible side of the hot gas giant exoplanet WASP-43 b, as the planet orbits its star.The temperatures were calculated based on the brightness of 5- to 12-micron mid-infrared light detected from the star-planet system by MIRI (the Mid-Infrared Instrument) on the NASA/ESA/CSA James Webb Space Telescope. In general, the hotter an object is, the more mid-infrared light it gives off.Because WASP-43 b orbits so close to its star (about 0.014 astronomical units), it is tidally locked. This results in a clear temperature difference between the dayside and nightside. The amount of infrared light detected from the planet is greatest when the hot dayside faces the telescope, just before and after it passes behind the star (a phenomenon known as a secondary eclipse). The planet appears much dimmer in infrared light when the cooler nightside faces the telescope, as it moves across the star (the transit).The exact difference in temperature, however, also depends on factors such as wind speeds and cloud cover. Based on the MIRI observations, WASP-43 b has an average temperature of about 1,250°C on the dayside and 600°C on the nightside. This is consistent with strong winds that carry heat around from the dayside to the nightside, and the presence of nightside clouds that prevent heat energy from escaping to space.The temperature maps were made by carefully analysing the change in temperature as different parts of the planet rotate into and out of view. The research indicates that the hottest point on the planet is not the point that receives the most light from the star (the substellar point, where the star is straight above in the sky). Instead, it is shifted about 7 degrees eastward. (This is why the maps look slightly off-centre.) This is a result of strong equatorial winds, which blow at speeds upwards of roughly 8000 kilometres per hour, moving the hot air horizontally before it can radiate energy back out to space.WASP-43 b orbits a star roughly 280 light-years away, in the constellation Sextans.Learn more here. [Image description: TOP - Phase Curve 1 ¼ Orbits; MIRI Low-Resolution Spectroscopy showing a graph of brightness over time with a hazy blue planet in the background. BOTTOM - Temperature Maps; MIRI Low-Resolution Spectroscopy” showing telescope-facing hemisphere of planet at 4 orbital positions.] |
| Date | 30 April 2024 (upload date) |
| Source | Hot gas giant exoplanet WASP-43 b (MIRI phase curve and temperature map) |
| Author | NASA, ESA, CSA, R. Crawford (STScI), T. Bell (BAERI), J. Barstow (The Open University), M. Roman (University of Leicester) |
| Other versions |
|
_(WASP43b-2).jpg)
Licensing
[edit] |
ESA/Webb images, videos and web texts are released by the ESA under the Creative Commons Attribution 4.0 International license and may on a non-exclusive basis be reproduced without fee provided they are clearly and visibly credited. Detailed conditions are below; see the ESA copyright statement for full information. For images created by NASA or on the webbtelescope.org website, use the {{PD-Webb}} tag.
Conditions:
Notes:
|
 |
This file is licensed under the Creative Commons Attribution 4.0 International license.
Attribution: NASA, ESA, CSA, R. Crawford (STScI), T. Bell (BAERI), J. Barstow (The Open University), M. Roman (University of Leicester)
- You are free:
- to share – to copy, distribute and transmit the work
- to remix – to adapt the work
- Under the following conditions:
- attribution – You must give appropriate credit, provide a link to the license, and indicate if changes were made. You may do so in any reasonable manner, but not in any way that suggests the licensor endorses you or your use.
File history
Click on a date/time to view the file as it appeared at that time.
| Date/Time | Thumbnail | Dimensions | User | Comment | |
|---|---|---|---|---|---|
| current | 10:02, 1 May 2024 |  | 4,420 × 6,250 (7.66 MB) | OptimusPrimeBot (talk | contribs) | #Spacemedia - Upload of https://esawebb.org/media/archives/images/original/WASP43b-2.tif via Commons:Spacemedia |
You cannot overwrite this file.
File usage on Commons
The following page uses this file: