File:German states by nominal GRP per capita in 2016.png
Jump to navigation
Jump to search

Size of this preview: 558 × 599 pixels. Other resolutions: 223 × 240 pixels | 447 × 480 pixels | 715 × 768 pixels | 953 × 1,024 pixels | 1,907 × 2,048 pixels | 4,191 × 4,501 pixels.
Original file (4,191 × 4,501 pixels, file size: 1.24 MB, MIME type: image/png)
Captions
Captions
Add a one-line explanation of what this file represents
Summary
[edit]
| Description |
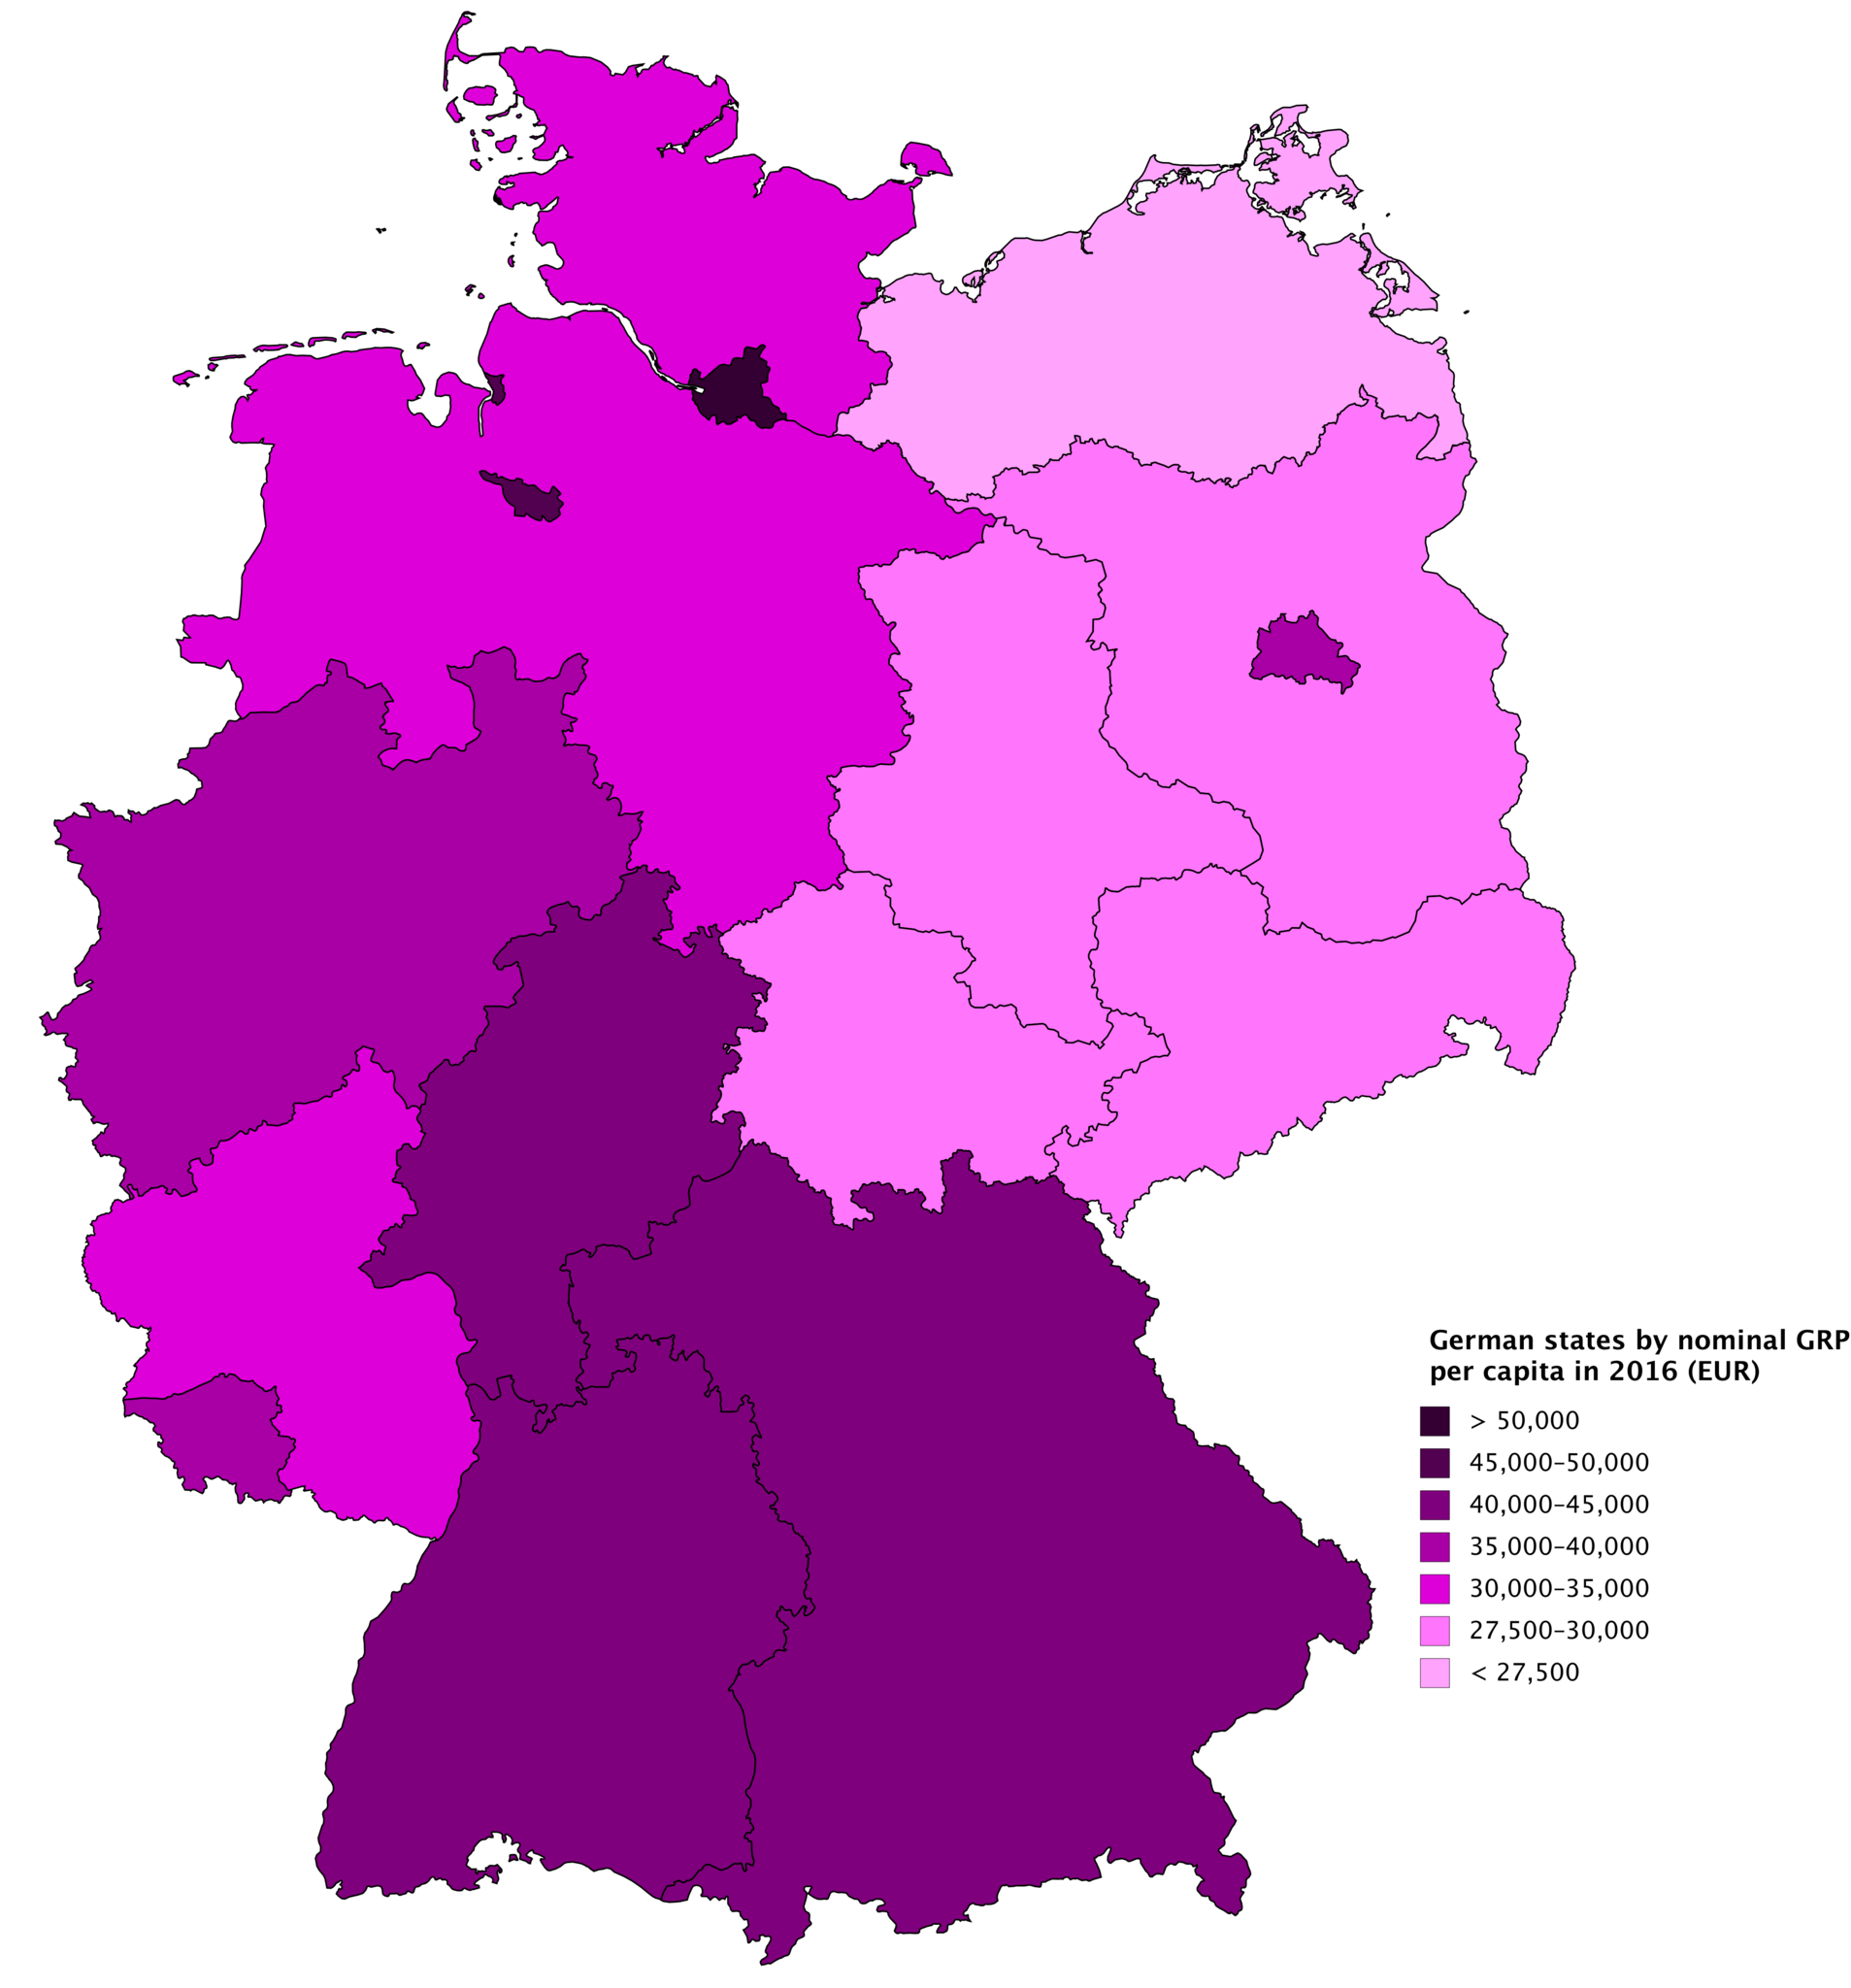
English: A choropleth map showing the states (including city-states) of Germany by nominal gross regional product (GRP) per capita in 2016 in euros, based on data from Eurostat. |
| Date | |
| Source | Own work |
| Author | JackintheBox |
Licensing
[edit]
| This map was created for free at MapChart.net. All maps created there are licensed under the Creative Commons Attribution-ShareAlike 4.0 International License. See the "Licensing" link on the home page, or the MapChart.net feedback page for the image license info, and this MapChart.net Commons discussion. Use {{Mapchart.net}} to provide attribution for maps created with that service.
See also: Other maps on Commons created with Mapchart.net: Category:Mapchart.net and this search query; other map and chart resources. |
I, the copyright holder of this work, hereby publish it under the following license:
This file is licensed under the Creative Commons Attribution-Share Alike 4.0 International license.
- You are free:
- to share – to copy, distribute and transmit the work
- to remix – to adapt the work
- Under the following conditions:
- attribution – You must give appropriate credit, provide a link to the license, and indicate if changes were made. You may do so in any reasonable manner, but not in any way that suggests the licensor endorses you or your use.
- share alike – If you remix, transform, or build upon the material, you must distribute your contributions under the same or compatible license as the original.
File history
Click on a date/time to view the file as it appeared at that time.
| Date/Time | Thumbnail | Dimensions | User | Comment | |
|---|---|---|---|---|---|
| current | 09:01, 4 August 2018 | | 4,191 × 4,501 (1.24 MB) | JackintheBox (talk | contribs) | Original map chart |
| 08:55, 4 August 2018 |  | 4,235 × 4,505 (1.24 MB) | JackintheBox (talk | contribs) | Reverted to version as of 08:54, 4 August 2018 (UTC) | |
| 08:55, 4 August 2018 |  | 4,235 × 4,505 (1.19 MB) | JackintheBox (talk | contribs) | Reverted to version as of 18:14, 23 July 2018 (UTC) | |
| 08:54, 4 August 2018 |  | 4,235 × 4,505 (1.24 MB) | JackintheBox (talk | contribs) | Thank you for creating a new map chart for 2017 figures, but please upload it as a separate file - I would still like to use the original version for 2016 in the article along with your map chart for 2017 figures. | |
| 18:14, 23 July 2018 |  | 4,235 × 4,505 (1.19 MB) | Radom1967 (talk | contribs) | Updated to 2017 data | |
| 04:45, 22 May 2018 |  | 4,235 × 4,505 (1.24 MB) | JackintheBox (talk | contribs) | User created page with UploadWizard |
You cannot overwrite this file.
File usage on Commons
There are no pages that use this file.