
Category:GDP per capita
Subcategories
This category has only the following subcategory.
G
Media in category "GDP per capita"
The following 118 files are in this category, out of 118 total.
-
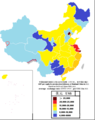 2021年中國各省人均gdp.png 990 × 1,246; 334 KB
-
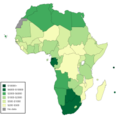
 African countries by GDP (PPP) per capita in 2017.png 4,800 × 4,795; 1.39 MB
-
 African countries by GDP (PPP) per capita in 2020-hy.png 2,048 × 2,045; 508 KB
-
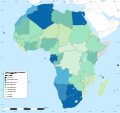
 African countries by GDP (PPP) per capita in 2020.png 4,800 × 4,795; 1.05 MB
-
 African countries by GDP (PPP) per capita in 2020.svg 1,430 × 1,350; 1.17 MB
-
 African countries by GDP (PPP) per capita in 2023.png 4,800 × 4,795; 1.02 MB
-
 Air-pollution-vs-gdp-per-capita.png 3,400 × 2,400; 413 KB
-
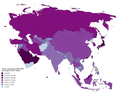 Asian countries by GDP (PPP) per capita in 2017.png 3,885 × 3,087; 2.11 MB
-
 Average GDP PPP per capita new.svg 940 × 415; 1.59 MB
-
 Average GDP PPP per capita.PNG 1,350 × 625; 48 KB
-
 Average GDP PPP per capita.svg 940 × 415; 1.59 MB
-
 Barbados GDP per capita.svg 968 × 630; 43 KB
-
 BNP perfhoofd 2011 upd.png 1,350 × 625; 56 KB
-
 Brazilian States by GDP per capita 2007.svg 780 × 687; 638 KB
-
 Capita2012.png 1,350 × 652; 49 KB
-
 Capita2013PPA.png 1,350 × 652; 58 KB
-
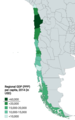 Chilean Regions by GDP per capita 2014.png 940 × 1,509; 268 KB
-
 Countries by GDP (PPP) per capita in 2017.png 6,300 × 3,082; 1.93 MB
-
 Countries by GDP (PPP) per capita in 2019.png 5,990 × 2,740; 1.54 MB
-
 Countries by GDP (PPP) per capita in 2020.png 5,990 × 2,740; 1.25 MB
-
 CountriesByGDPPerCapitaNominal2018.png 1,425 × 625; 47 KB
-
 Cuba GDP per Capita.png 5,301 × 3,530; 447 KB
-
 Dutch provinces by nominal GRP per capita in 2016.png 4,290 × 4,700; 1.11 MB
-
 EAEU GDP per capita.svg 1,281 × 641; 168 KB
-
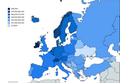
 Europe-GDP-PPP-per-capita-map-worldbank.png 720 × 600; 92 KB
-
 Evolution of GDP per capita in some former Soviet countries.svg 842 × 595; 21 KB
-
 Evolution of GDP PPP per capita of Georgia compared to other countries.svg 1,305 × 770; 210 KB
-
 Evolution of GDP PPP per capita of Georgia, Armenia & Azerbaijan.svg 1,305 × 770; 187 KB
-
 Evolution of GDP PPP per capita of Georgia, Moldova & Ukraine.svg 1,305 × 770; 185 KB
-
 GDP (nominal) per capita map.png 940 × 415; 135 KB
-
 GDP (PPP) Per Capita Around the World 2023.png 1,920 × 1,080; 326 KB
-
 GDP (PPP) per capita, 2012 IMF.jpg 3,600 × 1,640; 534 KB
-
 GDP BRIC Bulgaria 1984-2009.png 712 × 456; 30 KB
-
 GDP by State.PNG 781 × 507; 161 KB
-
 GDP nominal per capita world map IMF 2007.PNG 1,350 × 625; 52 KB
-
 GDP nominal per capita world map IMF 2008.png 1,800 × 820; 187 KB
-
 GDP nominal per capita world map IMF 2008.svg 940 × 415; 1.43 MB
-
 GDP nominal per capita world map IMF 2009.png 1,350 × 625; 51 KB
-
 GDP nominal per capita world map IMF figures for year 2004.png 2,250 × 1,117; 170 KB
-
 GDP nominal per capita world map IMF figures for year 2005.png 2,250 × 1,117; 176 KB
-
 GDP nominal per capita world map IMF figures for year 2006.png 2,250 × 1,117; 170 KB
-
 GDP per capita (nominal) 2011.png 1,350 × 625; 38 KB
-
 GDP per capita (nominal) 2014.png 1,350 × 625; 38 KB
-
 GDP per capita (nominal) 2015.png 1,350 × 625; 49 KB
-
 GDP per capita -2006-blank.svg 940 × 477; 2.26 MB
-
 GDP per capita of Botswana, 1950 to 2016.png 3,400 × 2,400; 454 KB
-
 GDP per capita of Chinese provinces.JPG 900 × 794; 120 KB
-
 GDP per capita of the Nordic countries in USD, 1990 to 2017.svg 850 × 600; 34 KB
-
 GDP per capita PPP 2014-en.svg 1,024 × 559; 486 KB
-
 GDP per capita PPP 2014-fr.svg 1,024 × 559; 486 KB
-
 GDP per capita PPP vs 20 to 20 ratio 2016.svg 1,506 × 850; 82 KB
-
 GDP per capita PPP vs CIT 2016.svg 1,513 × 850; 66 KB
-
 GDP per capita PPP vs direct taxes 2016.svg 1,513 × 850; 66 KB
-
 GDP per capita PPP vs excises 2016.svg 1,513 × 850; 70 KB
-
 GDP per capita PPP vs Gini index 2016.svg 1,506 × 850; 557 KB
-
 GDP per capita PPP vs import taxes 2016.svg 1,513 × 850; 65 KB
-
 GDP per capita PPP vs indirect taxes 2016.svg 1,513 × 850; 68 KB
-
 GDP per capita PPP vs Palma ratio 2016.svg 1,506 × 850; 82 KB
-
 GDP per capita PPP vs PIT 2016.svg 1,513 × 850; 62 KB
-
 GDP per capita PPP vs property taxes 2016.svg 1,513 × 850; 63 KB
-
 GDP per capita PPP vs social contributions 2016.svg 1,513 × 850; 68 KB
-
 GDP per capita PPP vs taxes 2016.svg 1,513 × 850; 72 KB
-
 GDP per capita PPP vs VAT 2016.svg 1,513 × 850; 65 KB
-
 Gdp per capita ppp world map 2005 copy one colour.png 1,400 × 714; 48 KB
-
 Gdp per capita ppp world map 2005.PNG 1,357 × 714; 50 KB
-
 Gdp per capita ppp world map.PNG 1,788 × 881; 40 KB
-
 GDP Per Capita, 2018.png 3,400 × 2,400; 791 KB
-
 GDP per capita, OWID.svg 850 × 600; 13 KB
-
 GDP per head Europe 1937.png 817 × 646; 43 KB
-
 GDP PPP per capita 2007 CIA.png 1,500 × 630; 69 KB
-
 GDP PPP per capita 2007 IMF.png 1,500 × 630; 49 KB
-
 GDP PPP per capita 2007 WB.png 1,500 × 630; 69 KB
-
 GDP PPP per capita 2009 IMF.png 1,500 × 630; 70 KB
-
 GDP PPP Per Capita IMF 2008.png 1,800 × 820; 186 KB
-
 GDP PPP Per Capita IMF 2008.svg 1,800 × 820; 1.03 MB
-
 GDP PPP per capita IMF.png 1,410 × 640; 40 KB
-
 GDP PPP per capita world map IMF figures for year 2006.png 2,250 × 1,117; 163 KB
-
 GDP PPP per capita world map IMF figures year 2006(2).png 1,357 × 714; 50 KB
-
 GDP PPP Per Capita Worldmap 2007 CIA factbook.PNG 1,350 × 625; 48 KB
-
 GDP PPP Per Capita Worldmap 2008 CIA Factbook.svg 940 × 415; 1.64 MB
-
 GDP vs Energy Consumption 2012.svg 853 × 618; 67 KB
-
 Gdppercapita hungary.png 603 × 353; 26 KB
-
 GDPPPPPercapita2009WorldBan.svg 940 × 477; 1.27 MB
-
 Georgian regions by GDP per capita in 2022 (GEL).png 1,200 × 722; 64 KB
-
 German states by nominal GRP in 2017.png 4,235 × 4,505; 1.27 MB
-
 German states by nominal GRP per capita in 2016.png 4,191 × 4,501; 1.24 MB
-
 Globalization-5.png 669 × 669; 200 KB
-
 GSP per capita in 2015.png 529 × 863; 93 KB
-
 Homofobia vs GDP (en).svg 925 × 574; 73 KB
-
 Homofobia vs GDP.svg 925 × 574; 73 KB
-
 Indian states and union territories by GRDP (nominal) per capita.png 3,818 × 4,600; 1.19 MB
-
 IQ vs GDP per capita.png 4,837 × 2,135; 705 KB
-
 Maddison-data-gdp-per-capita-in-2011us-single-benchmark.svg 850 × 600; 61 KB
-
 Map of Africa by 2017 nominal GDP per capita (USD).png 4,800 × 4,795; 884 KB
-
 MapChart Map (5).png 4,592 × 3,196; 1.17 MB
-
 NUTS-2 regions of Poland by GDP per capita (2023).png 6,000 × 4,650; 1,007 KB
-

-
 Pakistani administrative units by nominal GSP per capita (USD).png 2,859 × 2,218; 328 KB
-
 PIB par habitant en France 1820-2003.svg 512 × 361; 63 KB
-
 PIB par habitant Italie 2004.jpg 454 × 585; 124 KB
-
 PIL pro capite vs Percentuale di famiglie unipersonali.png 661 × 442; 41 KB
-
 Polish voivodeships by GRP (PPS) per capita in 2015.png 5,120 × 3,964; 1.11 MB
-
 Renta per capita mundial en los dos últimos milenios.svg 1,439 × 868; 30 KB
-
 Russia GDP per capita by regions 2010 (current rubles).svg 512 × 240; 133 KB
-
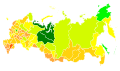 Russia GRP per capita 2008 US dollars (nominal).svg 825 × 485; 175 KB
-
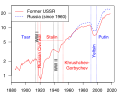 Russian economic history 1885-2018.svg 405 × 315; 65 KB
-
 SouthAmericaGDPnominalPerCapita2018.png 240 × 320; 232 KB
-
 SouthAmericaPerCapitaPPP.png 240 × 320; 233 KB
-
 TwoKoreasGDPPerCapita.svg 774 × 518; 223 KB
-
 UK GDP per Capita in 2016.png 567 × 827; 120 KB
-
 US GDP per capita by state 2010 (current dollars).svg 512 × 240; 64 KB
-
 World GDP per capita 1500 to 2003.png 1,600 × 1,200; 83 KB
-
 World GDP per capita 1500 to 2003.svg 1,600 × 1,200; 3 KB
-
 World map GDP per capita.svg 1,405 × 601; 389 KB
-
-

-
-
 ВРП по субъектам РФ на душу населения 2011.svg 1,000 × 573; 239 KB

_per_capita_in_2017.png)
_per_capita_in_2020-hy.png)
_per_capita_in_2020.png)
_per_capita_in_2020.svg)
_per_capita_in_2023.png)

_per_capita_in_2017.png)


_per_capita_in_2017.png)
_per_capita_in_2019.png)
_per_capita_in_2020.png)


_per_capita_map.png)
_Per_Capita_Around_the_World_2023.png)
_per_capita,_2012_IMF.jpg)


_2011.png)
_2014.png)
_2015.png)


.png)


.png)


.svg)

_per_capita.png)


.png)
.png)
.png)

.png)


_per_capita_in_2015.png)

.svg)
.svg)


.svg)


