File:Geospeedometry diffusion illustration.pdf
Jump to navigation
Jump to search

Size of this JPG preview of this PDF file: 800 × 450 pixels. Other resolutions: 320 × 180 pixels | 640 × 360 pixels | 1,024 × 576 pixels | 1,280 × 720 pixels | 2,000 × 1,125 pixels.
Original file (2,000 × 1,125 pixels, file size: 495 KB, MIME type: application/pdf)
Captions
Captions
Add a one-line explanation of what this file represents
Summary
[edit]| Description |
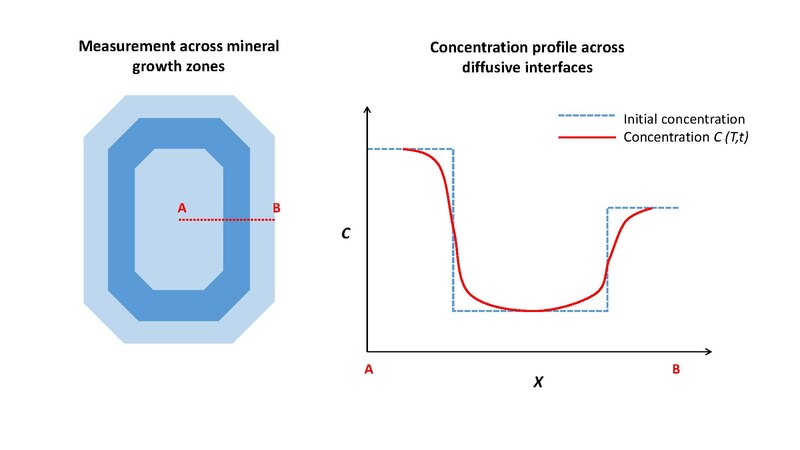
English: Schematic diffusion profile of an element across growth zones of an igneous mineral; graph depicts position (x) and concentration (C). The blue zones are representative of igneous growth zones of a mineral, with an initially sharp concentration gradient between zones (represented by dashed blue line on graph). The red dashed line represents a hypothetical measurement transect, which is represented by the red line on the graph. |
| Date | |
| Source | Own work |
| Author | Ellen00a |
Licensing
[edit]I, the copyright holder of this work, hereby publish it under the following license:
This file is licensed under the Creative Commons Attribution-Share Alike 4.0 International license.
- You are free:
- to share – to copy, distribute and transmit the work
- to remix – to adapt the work
- Under the following conditions:
- attribution – You must give appropriate credit, provide a link to the license, and indicate if changes were made. You may do so in any reasonable manner, but not in any way that suggests the licensor endorses you or your use.
- share alike – If you remix, transform, or build upon the material, you must distribute your contributions under the same or compatible license as the original.
File history
Click on a date/time to view the file as it appeared at that time.
| Date/Time | Thumbnail | Dimensions | User | Comment | |
|---|---|---|---|---|---|
| current | 20:35, 27 February 2017 |  | 2,000 × 1,125 (495 KB) | Ellen00a (talk | contribs) | Cross-wiki upload from en.wikipedia.org |
You cannot overwrite this file.
File usage on Commons
There are no pages that use this file.
File usage on other wikis
The following other wikis use this file:
- Usage on en.wikipedia.org