File:Confining-Domains-Lead-to-Reaction-Bursts-Reaction-Kinetics-in-the-Plasma-Membrane-pone.0032948.s006.ogv
Jump to navigation
Jump to search
Size of this JPG preview of this OGG file: 800 × 300 pixels. Other resolutions: 320 × 120 pixels | 640 × 240 pixels | 1,280 × 480 pixels.
Original file (Ogg Theora video file, length 44 s, 1,280 × 480 pixels, 1.21 Mbps, file size: 6.34 MB)
Captions
Captions
Add a one-line explanation of what this file represents
Summary
[edit]| Description |
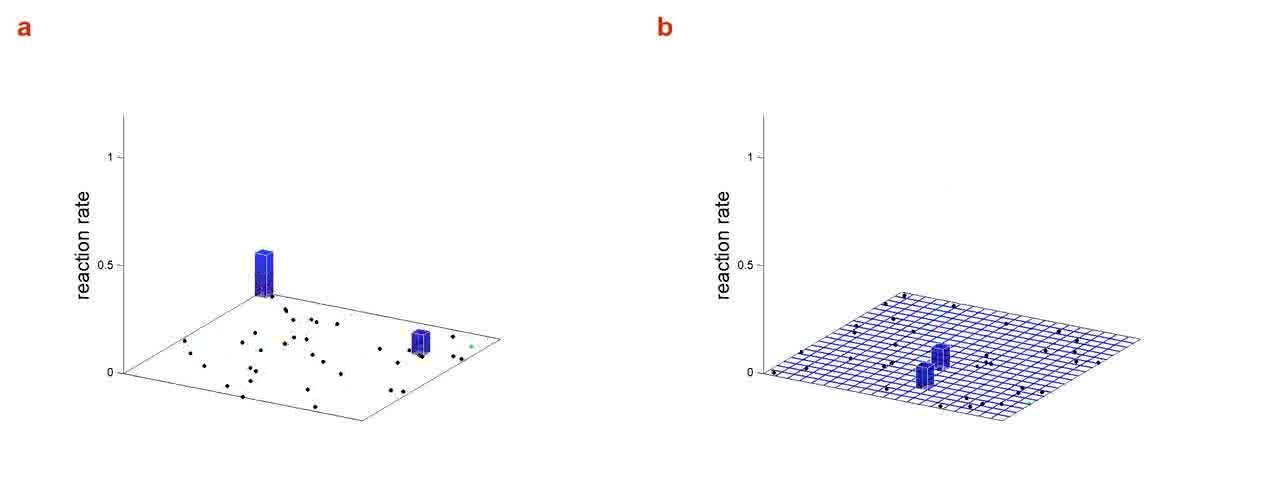
English: Visualization of our Monte Carlo simulation based on the lattice model. Black circles correspond to diffusing reactants that can form a dimer, which is indicated by a red circle. One of the reactants is shown in green and represents the tracer. The -axis is proportional to the local reaction rate, which is the mean number of reactions that took place in the corresponding compartment during the last 100 simulation steps, multiplied by 10. a. a simulation run in the absence of compartments (). b. the effect of compartments on reaction kinetics (). It is readily observed that in a, reactions take place more frequently all over the simulation region; however, the local reaction rate, depicted by the height of the bars, is much lower compared to those in b. We refer to the brief but large increases in the local reaction rate in b as “bursts”, which become more and more apparent with increasing confinement strength. In both cases, the visualization is accelerated such that the configuration of the system is shown only around times when a reaction takes place. Parameter values are , , , , . |
||
| Date | |||
| Source | Video S1 from Kalay Z, Fujiwara T, Kusumi A (2012). "Confining Domains Lead to Reaction Bursts: Reaction Kinetics in the Plasma Membrane". PLOS ONE. DOI:10.1371/journal.pone.0032948. PMID 22479350. PMC: 3314009. | ||
| Author | Kalay Z, Fujiwara T, Kusumi A | ||
| Permission (Reusing this file) |
|
||
| Provenance |
|
File history
Click on a date/time to view the file as it appeared at that time.
| Date/Time | Thumbnail | Dimensions | User | Comment | |
|---|---|---|---|---|---|
| current | 09:56, 15 November 2012 | 44 s, 1,280 × 480 (6.34 MB) | Open Access Media Importer Bot (talk | contribs) | Automatically uploaded media file from Open Access source. Please report problems or suggestions here. |
You cannot overwrite this file.
File usage on Commons
There are no pages that use this file.