File:Actomyosin-dependent-dynamic-spatial-patterns-of-cytoskeletal-components-drive-mesoscale-podosome-ncomms13127-s19.ogv
Jump to navigation
Jump to search
Size of this JPG preview of this OGG file: 625 × 599 pixels. Other resolutions: 250 × 240 pixels | 501 × 480 pixels | 700 × 671 pixels.
Original file (Ogg Theora video file, length 12 s, 700 × 671 pixels, 11.39 Mbps, file size: 16.47 MB)
Captions
Captions
Add a one-line explanation of what this file represents
Summary
[edit]| Description |
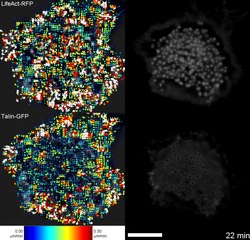
English: Supplementary Movie 18 Actin polymerization and network integrity are essential for actin flux in podosome clusters. DCs were co-transfected with LifeAct-RFP (top) and talin-GFP (bottom) and seeded in a glass bottom dish. Imaging was performed at a confocal microscope with 15 second frame intervals, after 50 frames 2.5 μg ml-1 CytoD was added and imaging was continued up to 100 frames. Time series for both channels were subjected to twSTICS analysis. The original Movies are shown as a moving average of 10 frames to allow direct comparison with the vector maps, which are calculated over 10 frames. The arrows indicate direction of flow and the size and colour coding of the vectors are representative of the flow magnitude. The vector map is plotted onto the immobile filtered version of the time series. Scale bar represents 10 μm. |
||
| Date | |||
| Source | Video file from Meddens M, Pandzic E, Slotman J, Guillet D, Joosten B, Mennens S, Paardekooper L, Houtsmuller A, van den Dries K, Wiseman P, Cambi A (2016). "Actomyosin-dependent dynamic spatial patterns of cytoskeletal components drive mesoscale podosome organization". Nature Communications. DOI:10.1038/ncomms13127. PMID 27721497. PMC: 5062568. | ||
| Author | Meddens M, Pandzic E, Slotman J, Guillet D, Joosten B, Mennens S, Paardekooper L, Houtsmuller A, van den Dries K, Wiseman P, Cambi A | ||
| Permission (Reusing this file) |
This file is licensed under the Creative Commons Attribution 4.0 International license.
|
||
| Provenance |
|
File history
Click on a date/time to view the file as it appeared at that time.
| Date/Time | Thumbnail | Dimensions | User | Comment | |
|---|---|---|---|---|---|
| current | 16:39, 29 October 2016 | 12 s, 700 × 671 (16.47 MB) | Open Access Media Importer Bot (talk | contribs) | Automatically uploaded media file from Open Access source. Please report problems or suggestions here. |
You cannot overwrite this file.
File usage on Commons
There are no pages that use this file.