File:2010 UK election popular vote vs representation.svg
Jump to navigation
Jump to search

Size of this PNG preview of this SVG file: 799 × 554 pixels. Other resolutions: 320 × 222 pixels | 640 × 444 pixels | 1,024 × 710 pixels | 1,280 × 888 pixels | 2,560 × 1,775 pixels.
Original file (SVG file, nominally 799 × 554 pixels, file size: 5 KB)
Captions
Captions
Add a one-line explanation of what this file represents
| Description |
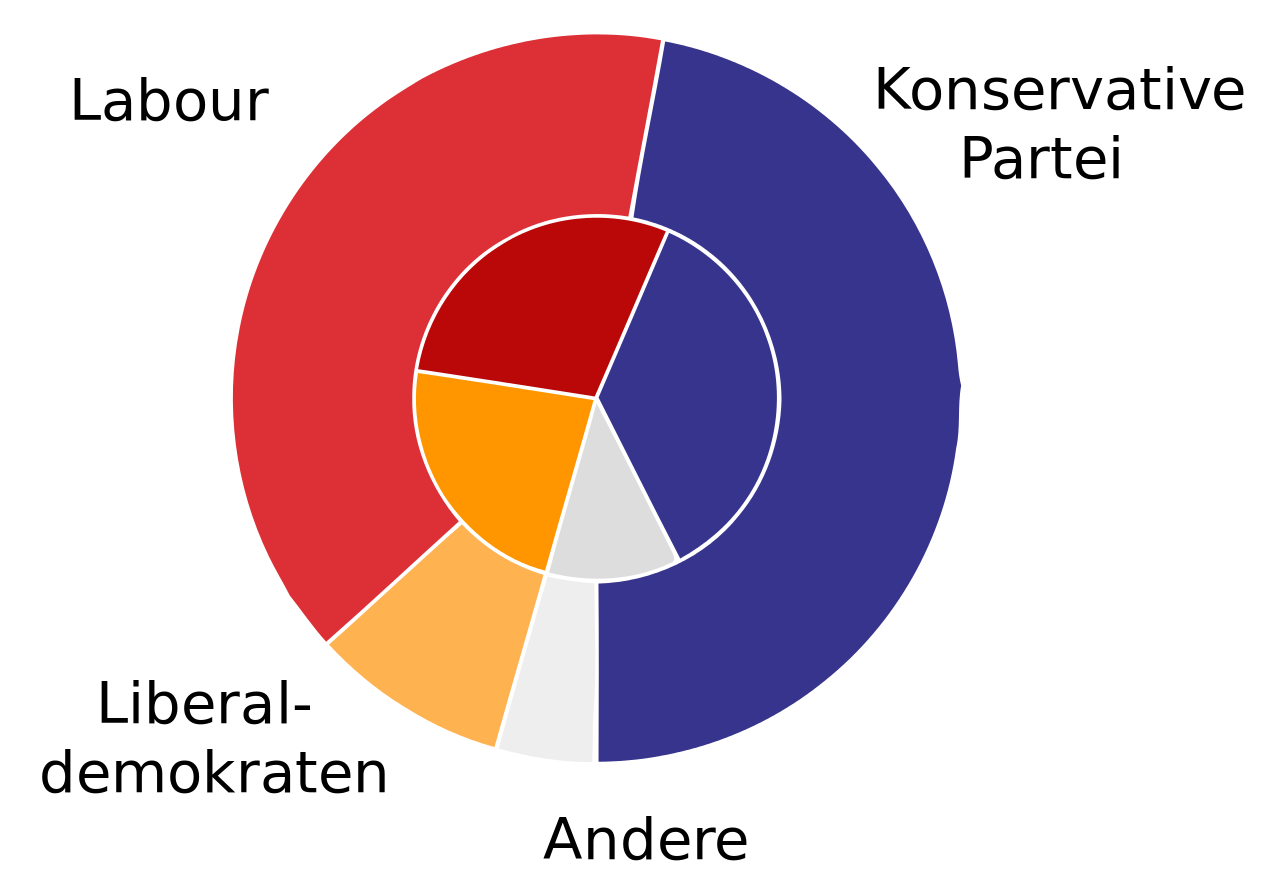
Deutsch: Auswirkungen des einfachen Mehrheitswahlrechts bei den Unterhauswahlen 2010 im Vereinigten Königreich: innerer Kreis = Wählerstimmen, äußerer Kreis = gewonnene Unterhausmandate. English: (chart of) vote to seat conversion in 2010 may 6th UK general election under first-past-the-post (the then-current conversion system) |
| Date | (UTC) |
| Source |
This file was derived from: Chartinguk20100506electionvotesandseats.png |
| Author |
Vector: (conversion to SVG and used German text) |
| SVG development | This W3C-invalid diagram was created with Adobe Illustrator. |
Maki Lam, the copyright holder of this work, hereby publishes it under the following licenses:
This file is licensed under the Creative Commons Attribution-Share Alike 3.0 Unported license.
Attribution: Maki Lam
- You are free:
- to share – to copy, distribute and transmit the work
- to remix – to adapt the work
- Under the following conditions:
- attribution – You must give appropriate credit, provide a link to the license, and indicate if changes were made. You may do so in any reasonable manner, but not in any way that suggests the licensor endorses you or your use.
- share alike – If you remix, transform, or build upon the material, you must distribute your contributions under the same or compatible license as the original.

|
Permission is granted to copy, distribute and/or modify this document under the terms of the GNU Free Documentation License, Version 1.2 or any later version published by the Free Software Foundation; with no Invariant Sections, no Front-Cover Texts, and no Back-Cover Texts. A copy of the license is included in the section entitled GNU Free Documentation License. |
You may select the license of your choice.
Original upload log
[edit]
This image is a of the following images:
- File:Chartinguk20100506electionvotesandseats.png licensed with Cc-by-sa-3.0, GFDL
- 2010-05-10T13:23:21Z Maki Lam 500x300 (28273 Bytes) {{Information |Description=(chart of) vote to seat conversion in 2010 may 6th UK general election under first-past-the-post (the then-current conversion system) |Source=http://makiaea.tumblr.com/ |Date=20100508 |Author=Maki L
Uploaded with derivativeFX
File history
Click on a date/time to view the file as it appeared at that time.
| Date/Time | Thumbnail | Dimensions | User | Comment | |
|---|---|---|---|---|---|
| current | 19:59, 8 June 2010 | | 799 × 554 (5 KB) | Furfur (talk | contribs) | kosmetische Änderungen |
| 19:56, 8 June 2010 |  | 781 × 554 (4 KB) | Furfur (talk | contribs) | {{Information |Description={{de|1=Auswirkungen des einfachen Mehrheitswahlrechts bei den Unterhauswahlen 2010 im Vereinigten Königreich: innerer Kreis = Wählerstimmen, äußerer Kreis = gewonnene Unterhausmandate.} |
You cannot overwrite this file.
File usage on Commons
There are no pages that use this file.
File usage on other wikis
The following other wikis use this file:
- Usage on de.wikipedia.org
- Usage on es.wikipedia.org