Category:World maps of malnutrition
Jump to navigation
Jump to search
Subcategories
This category has only the following subcategory.
H
Media in category "World maps of malnutrition"
The following 27 files are in this category, out of 27 total.
-
 Child-stunting-ihme (4).png 3,400 × 2,400; 750 KB
-
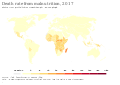 Death rate from malnutrition, OWID.svg 850 × 600; 141 KB
-
 FAO Hunger Map 2019-2021.svg 2,192 × 1,135; 1.64 MB
-
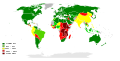
 GHI 2011 Severity Map.jpg 2,207 × 1,550; 679 KB
-
 GHI2010 Severity Map.jpg 2,481 × 1,754; 500 KB
-
 Global malnutrition.png 1,425 × 625; 41 KB
-
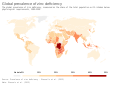 Global prevalence of zinc deficiency, OWID.svg 850 × 600; 140 KB
-
 Hunger Map 2020 World Food Programme.svg 2,192 × 1,135; 1.62 MB
-
 Hunger Map 2021 World Food Programme.svg 2,192 × 1,135; 1.62 MB
-
 Nutritional deficiencies world map - DALY - WHO2002.svg 940 × 415; 1.45 MB
-
 Nutritional deficiencies world map - DALY - WHO2004.svg 940 × 415; 1.45 MB
-
 Percentage population undernourished of world.png 833 × 451; 114 KB
-
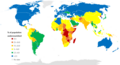
 Percentage population undernourished world map 2012.svg 940 × 477; 1.66 MB
-
 Percentage population undernourished world map-ar.PNG 1,355 × 768; 46 KB
-
 Percentage population undernourished world map.PNG 1,237 × 559; 161 KB
-
 Población mundial desnutrida.PNG 1,355 × 768; 47 KB
-
 Prevalence-of-undernourishment.png 3,400 × 2,400; 826 KB
-
 Prevalence-of-undernourishment.svg 850 × 600; 169 KB
-
 Protein-energy malnutrition world map - DALY - WHO2002.svg 940 × 415; 1.45 MB
-
 Protein-energy malnutrition world map - DALY - WHO2004.svg 940 × 415; 1.45 MB
-
 Protein-energy malnutrition world map-DALYs per million persons-WHO2012.svg 940 × 415; 1.45 MB
-
 Share of the population that is undernourished, OWID.svg 850 × 600; 140 KB
-
 Share-of-children-underweight.png 3,400 × 2,400; 806 KB
-
 Sous-alimentation 2007.png 996 × 420; 29 KB
-
 SubnutricaoFAO.png 1,574 × 786; 372 KB
-
 WorldMapMalnutrition.png 1,357 × 628; 25 KB
-
 Zincdeficiency.png 3,400 × 2,400; 747 KB
.png)


