Category:World food statistics
Jump to navigation
Jump to search
Global food statistics (consumption, production, composition, etc)
Media in category "World food statistics"
The following 52 files are in this category, out of 52 total.
-
 Absolute change in the global average diet.jpg 601 × 925; 185 KB
-
 Animals-slaughtered-for-meat (OWID 0068).png 850 × 600; 58 KB
-

-

-
 Drivers of tropical deforestration.png 1,470 × 1,048; 440 KB
-
 Energy efficiency of meat and dairy production, OWID.svg 850 × 600; 5 KB
-
 Food energy supply by region, OWID.svg 850 × 600; 29 KB
-
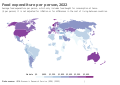 Food expenditure per person per year, OWID.svg 850 × 600; 148 KB
-
 Food-, land-, and climate change mitigation-gaps for 2050.jpg 2,813 × 719; 329 KB
-
 Food-loss-postharvest-by-region (OWID 0424).png 850 × 600; 79 KB
-
 Food-miles-by-transport (OWID 0418).png 850 × 600; 50 KB
-
 Fruit consumption by fruit type, OWID.svg 850 × 600; 32 KB
-
 GHI Map 2022.png 1,920 × 1,080; 258 KB
-
 GHI winners and losers from 1990 to 2008.jpg 2,133 × 1,040; 638 KB
-
 Global average human diet and protein composition and usage of crop-based products.webp 2,117 × 1,598; 176 KB
-
 Global food systems GHG emissions in 2020.png 602 × 501; 112 KB
-
-

-

-

-
 Global-food-loss-index.png 3,400 × 2,400; 483 KB
-
 Global-food-waste-by-region (OWID 0545).png 850 × 600; 56 KB
-
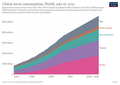
 Global-meat-consumption-1961-2009.png 1,208 × 693; 50 KB
-
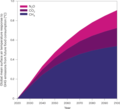
 Global-meat-projections-to-2050 (OWID 0533).png 850 × 600; 72 KB
-
 Indice Globale della Fame CESVI per gravità 2023.jpg 4,961 × 3,508; 3.28 MB
-
 Meat and Dairy CO2 Emissions - 20 largest emitters.png 2,066 × 1,351; 398 KB
-
 Meat production by region and production intensity in millions of tons.png 1,677 × 1,022; 106 KB
-
 Octopus capture.png 556 × 307; 52 KB
-
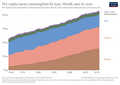
 Per capita annual meat consumption by region.png 1,299 × 776; 107 KB
-
 Per capita meat consumption by type, OWID.svg 850 × 600; 15 KB
-
-
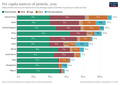 Per-capita-sources-of-protein (OWID 0856).png 850 × 600; 73 KB
-
 Prevalence of severe food insecurity by region, OWID.svg 850 × 600; 9 KB
-
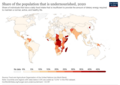 Prevalence-of-undernourishment.png 3,400 × 2,400; 826 KB
-

-

-
 Seafood production- wild fish catch vs aquaculture, 1, OWID.svg 850 × 600; 8 KB
-
 Seafood production- wild fish catch vs aquaculture, OWID.svg 850 × 600; 10 KB
-
 Seafood-and-fish-production-thousand-tonnes (OWID 0950).png 850 × 600; 74 KB
-
 Share of consumer expenditure spent on food, OWID.svg 850 × 600; 147 KB
-
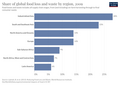
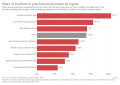 Share of food lost in post-harvest processes by region, OWID.svg 850 × 600; 8 KB
-
 Share of food lost in post-harvest processes, OWID.svg 850 × 600; 5 KB
-
 Share-food-miles-by-method (OWID 0908).png 850 × 600; 50 KB
-
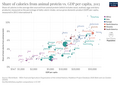 Share-of-calories-from-animal-protein-vs-gdp-per-capita (OWID 1005).png 850 × 600; 108 KB
-
 Share-of-population-with-moderate-or-severe-food-insecurity.png 3,400 × 2,400; 851 KB
-
 Supply chain losses by food commodity, OWID.svg 850 × 600; 28 KB
-
 Total annual meat consumption by region.png 1,263 × 821; 81 KB
-
 Total annual meat consumption by type of meat.png 1,108 × 861; 82 KB
-
 VegansByCountry.svg 790 × 510; 1.44 MB
-
 VegetarianismMappedPlain.svg 940 × 415; 2.14 MB
-
 VegetariansByCountry.svg 790 × 510; 1.44 MB
-
 Welthunger-Index 2018- Vereinfachte Karte.png 1,920 × 1,080; 411 KB

.png)

_over_time_(1990%E2%80%932017).png)


.png)


_from_future_food_consumption_under_a_high-population_projection.webp)


.png)

.png)


.png)
.png)


.png)


.png)
.png)


.png)