Category:Wealth statistics for the United States
Jump to navigation
Jump to search
Subcategories
This category has only the following subcategory.
M
Media in category "Wealth statistics for the United States"
The following 44 files are in this category, out of 44 total.
-

-

-
 2021 Household wealth by percentile - United States.svg 1,000 × 750; 2 KB
-
 2021 Median household wealth, by highest educational attainment - US.svg 1,000 × 750; 2 KB
-
 2021 Median wealth by marital status - US.svg 1,000 × 750; 2 KB
-
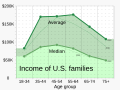 2022 Average and median family income, by age - US.svg 1,000 × 750; 3 KB
-
 2022 Average and median family net worth, by age - US.svg 1,000 × 750; 3 KB
-

-
 Average and median household wealth by age group in the United States.png 3,079 × 2,241; 355 KB
-
 Changeinmeanbefore-taxincomeUS1989-2004.png 579 × 346; 4 KB
-
 Changeinmeanbefore-taxincomeUS1989-2004.svg 610 × 330; 180 KB
-
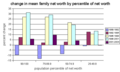 ChangeinmeannetworthUS1989-2004.png 578 × 346; 4 KB
-
 ChangeinmeannetworthUS1992-2004.png 578 × 346; 4 KB
-
 Changeinmedianbefore-taxincomeUS1989-2004.png 579 × 346; 5 KB
-
 ChangeinmediannetworthUS1989-2004.png 578 × 346; 4 KB
-
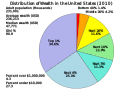 Distribution of Wealth in the United States 2010.svg 800 × 600; 24 KB
-
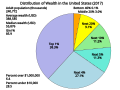
 Distribution of Wealth in the United States.jpg 677 × 482; 75 KB
-
 Distribution of Wealth in the United States.svg 800 × 600; 24 KB
-
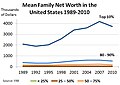
 Fredgraph-houshld-net-worth.png 630 × 378; 18 KB
-
 If US land mass were distributed like US wealth.png 500 × 442; 78 KB
-
 MeanNetWorth2007.png 879 × 639; 32 KB
-
 MeanNetWorthChange2007.png 879 × 639; 33 KB
-
 MeanNetWorthLog2007.png 879 × 639; 30 KB
-
 MedianNetWorth2007.png 879 × 639; 35 KB
-
 Net worth by percentile.webp 1,562 × 861; 26 KB
-
 Projected Wealth Inequality.png 1,115 × 784; 153 KB
-
 U.S. Distribution of Wealth, 2007.jpg 555 × 471; 54 KB
-
 U.S. economic variables related to the distribution of wealth and income.png 1,412 × 746; 100 KB
-
 United States wealth compared to the rest of the world.gif 613 × 331; 16 KB
-
 US derivatives and US wealth vs total world wealth 1995-2007.gif 856 × 406; 25 KB
-
 US distribution of wealth, 2013.svg 575 × 426; 40 KB
-
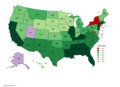 US Gini Map.png 5,175 × 3,762; 1.21 MB
-
 US household wealth 2000.svg 1,200 × 750; 4 KB
-
 US household wealth 2002.svg 1,200 × 750; 4 KB
-
 US household wealth 2004.svg 1,200 × 750; 4 KB
-
 US household wealth 2005.svg 1,200 × 750; 4 KB
-
 US household wealth 2009.svg 1,200 × 750; 4 KB
-
 US household wealth 2010.svg 1,200 × 750; 4 KB
-
 US household wealth 2011.svg 1,200 × 750; 4 KB
-
 US real median household income 1967 - 2011.PNG 977 × 595; 79 KB
-
 US Wealth Inequality - v2.png 728 × 500; 48 KB
-
 Wealth distribution by percentile in the United States.png 3,918 × 1,964; 290 KB
-
 Wealth Distribution, 1962-2007.pdf 1,500 × 1,125; 169 KB
-
 Wealth Inequality by Group 1989 to 2019.png 1,290 × 711; 172 KB


