Category:War casualty statistics
Jump to navigation
Jump to search
English: War casualty statistics
See also:
- en:List of wars and disasters by death toll
- en:List of battles by death toll
- en:Firestorm#Firestorms in cities
- en:List of battles and other violent events by death toll
- en:Category:War casualties
Resources:
- See the resource list of charting help and tools at Category:Charts.
- Statistical Summary: America's Major Wars [1]. U.S. Civil War Center.
- America's Wars: U.S. Casualties and Veterans [2]. Infoplease.
- Twentieth Century Atlas - Death Tolls [3] [4] [5] [6] [7] [8] [9] [10]
- Selected Death Tolls for Wars, Massacres and Atrocities Before the 20th Century [11].
- The world's worst massacres [12]. By Greg Brecht. Fall, 1987. Whole Earth Review.
Subcategories
This category has the following 4 subcategories, out of 4 total.
Media in category "War casualty statistics"
The following 43 files are in this category, out of 43 total.
-
2013-2014 fatalities in world conflicts.png 618 × 576; 48 KB
-
Afghanistan War Fatalities.svg 512 × 439; 12 KB
-
Al Aqaba map and info (OCHA May 2008).pdf 1,275 × 1,650, 2 pages; 1.29 MB
-
Battle-related deaths in state-based conflicts since 1946, OWID.svg 850 × 600; 17 KB
-
Chart representing the relative mortality of the Army at Home Wellcome L0064434.jpg 6,652 × 3,904; 4.12 MB
-
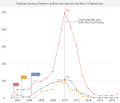
Coalition military casualties in afghanistan by month.PNG 939 × 493; 21 KB
-
Coalition military casualties in afghanistan by month.svg 3,600 × 1,500; 14 KB
-
Conflict Deaths 17 countries per year 2015-2020.png 1,013 × 773; 21 KB
-
Deadliest modern European wars by death toll.jpg 1,024 × 768; 97 KB
-
Death toll of Stalinism by country.jpg 497 × 556; 111 KB
-
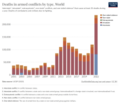
Deaths in armed conflicts by type from 1990 to 2002.png 3,400 × 2,944; 622 KB
-
Deaths in armed conflicts by type from 2001 to 2022.png 3,400 × 2,944; 625 KB
-
Deaths in armed conflicts by type from 2003 to 2022.png 3,400 × 2,944; 626 KB
-
Deaths of Russian soldiers in modern wars.jpg 1,021 × 731; 104 KB
-
Diagrams showing annual rate of mortality Wellcome L0050343.jpg 5,454 × 4,743; 3.22 MB
-
Diagrams showing population density Wellcome L0050341.jpg 6,579 × 2,630; 1.83 MB
-
Diagrams showing relative mortality Wellcome L0050342.jpg 4,898 × 4,984; 2.54 MB
-
Dokumentierte Todesfälle (SOHR).png 1,362 × 777; 198 KB
-
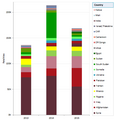
Fatalities 2013-2014-2015.png 490 × 517; 11 KB
-
Fatalities in the Syrian civil war (SOHR).png 1,201 × 755; 54 KB
-
G.B. Commission, sanitary condtion of army Wellcome L0017015.jpg 1,494 × 1,286; 719 KB
-
Gefallene US Soldaten Irak Afghanistan Statistik.png 1,110 × 600; 119 KB
-
Graph of global conflict deaths from 1500 to 1799 - Our World in Data.png 3,400 × 2,400; 371 KB
-
Graph of global conflict deaths from 1800 to 1899 - Our World in Data.png 3,400 × 2,400; 375 KB
-
Graph of global conflict deaths from 1900 to 1944 - Our World in Data.png 3,400 × 2,400; 306 KB
-
Graph of global conflict deaths from 1945 to 1989 - Our World in Data.png 3,400 × 2,400; 254 KB
-
Graph of global conflict deaths from 1990 to 2002 - Our World in Data.png 3,400 × 2,400; 235 KB
-
List of wars by death toll.jpg 1,455 × 869; 85 KB
-
Morti in conflitto armato in Libia (ACLED).png 616 × 563; 20 KB
-
State-based battle-related deaths per 100,000 since 1946, OWID.svg 850 × 600; 16 KB
-
Todesfälle Syrien bis Mai 2016 (SOHR).png 1,515 × 784; 238 KB
-
Todesopfer durch Kampfhandlungen seit 1950 (neu).png 1,350 × 347; 22 KB
-
Todesopfer durch Kampfhandlungen seit 1950.png 1,216 × 677; 68 KB
-
Two diagrams showing loss of strength in the Army Wellcome L0064435.jpg 6,664 × 3,956; 5.28 MB
-
War deaths caused by warfare FA.png 800 × 566; 42 KB
-
War deaths caused by warfare.svg 1,173 × 704; 165 KB
-
War deaths caused by warfareMortsHommesGuerre.jpg 1,174 × 690; 152 KB
-
Wardeaths.png 312 × 232; 4 KB
-
Wars by Death Toll Chart.jpg 2,296 × 2,045; 181 KB
-
Wars-Long-Run-military-civilian-fatalities.png 3,264 × 2,133; 815 KB


