Category:Votes % in UK regions at general elections
Jump to navigation
Jump to search
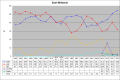
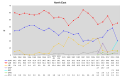
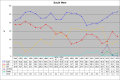
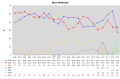
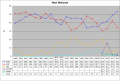
Graphs showing percentage votes across Regions of the Great Britain for general elections from 1945 to 2019.
Media in category "Votes % in UK regions at general elections"
The following 22 files are in this category, out of 22 total.
-
 East Midlands votes % 1945-2024.svg 955 × 625; 77 KB
-
 East Midlands votes %.svg 1,398 × 933; 138 KB
-
 East of England votes % 1945-2024.svg 955 × 625; 76 KB
-
 East of England votes %.svg 1,398 × 932; 140 KB
-
 London votes % 1945-2024.svg 955 × 625; 77 KB
-
 London votes %.svg 1,398 × 933; 139 KB
-
 North East votes % 1945-2024.svg 955 × 625; 77 KB
-
 North East votes %.svg 1,398 × 932; 137 KB
-
 North West votes % 1945-2024.svg 955 × 625; 76 KB
-
 North West votes %.svg 1,398 × 933; 138 KB
-
 Scotland votes % 1945-2024.svg 955 × 625; 90 KB
-
 Scotland votes %.svg 1,398 × 859; 156 KB
-
 South East votes % 1945-2024.svg 955 × 625; 77 KB
-
 South East votes %.svg 1,398 × 933; 136 KB
-
 South West votes % 1945-2024.svg 955 × 625; 77 KB
-
 South West votes %.svg 1,398 × 932; 142 KB
-
 Wales votes % 1945-2024.svg 955 × 625; 91 KB
-
 Wales votes %.svg 1,398 × 933; 140 KB
-
 West Midlands votes % 1945-2024.svg 955 × 625; 77 KB
-
 West Midlands votes %.svg 1,398 × 933; 141 KB
-
 Yorkshire and the Humber votes % 1945-2024.svg 955 × 625; 78 KB
-
 Yorkshire and the Humber votes %.svg 1,398 × 933; 143 KB


