Category:Vertical 3D bar charts
Jump to navigation
Jump to search
Media in category "Vertical 3D bar charts"
The following 200 files are in this category, out of 205 total.
(previous page) (next page)-
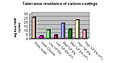 10.electroless.nickel.jpg 755 × 394; 37 KB
-
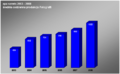
 1985~2001年の名阪特急輸送人員図.jpg 5,454 × 3,273; 1.03 MB
-
 2011 Fiscal year Foreign Food Inspection chart by FDA.png 981 × 628; 42 KB
-
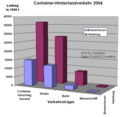 2013 11 16 Container Hinterland Verkehr.png 667 × 651; 31 KB
-
 2013 Hamburg Hafenumschlag 2000 2012 2025.png 848 × 829; 50 KB
-
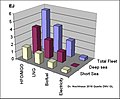 2018 10 16 Bild Energieverbrauch Schifffahrt 2050.jpg 1,031 × 850; 70 KB
-
 2018mainss.jpg 906 × 439; 137 KB
-
 22c196 Figure5.jpg 713 × 395; 29 KB
-
 22c196 Figure7.jpg 713 × 428; 36 KB
-
 22c196 Figure8.jpg 713 × 428; 35 KB
-
 3D Bar Graph Meeting.jpg 500 × 500; 94 KB
-
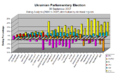
 3D.chart.-.swiss.weapon,.ammunition.and.detonator.exports.in.WW2.1940-1944.jpg 1,058 × 852; 114 KB
-
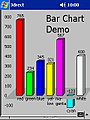 3DBarchart.jpg 240 × 320; 24 KB
-
 3dsyoutyuukou-age.PNG 375 × 561; 13 KB
-
 5and6legiseatcompar.png 513 × 407; 18 KB
-
 Abschieds-Alter-Perioden.PNG 851 × 623; 24 KB
-
 Aglomerace.PNG 675 × 316; 12 KB
-
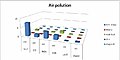 Air polution graph.JPG 705 × 355; 25 KB
-
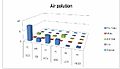 Air polution graph1.JPG 631 × 363; 22 KB
-
 Airbus vs Boeing.JPG 623 × 512; 41 KB
-
 Alter beim letzten Tor in der Nationalmannschaft.png 1,121 × 554; 36 KB
-
 Antalannonser2009.png 385 × 238; 21 KB
-
 Aquariumwerte.png 896 × 717; 17 KB
-
 Arroyo Grande - pyramide des âges.jpg 970 × 603; 44 KB
-
 B2.EIO-LCA Summary.jpg 797 × 504; 47 KB
-
 BankComparison.jpg 997 × 374; 60 KB
-
 BankEvolution.jpg 694 × 356; 52 KB
-
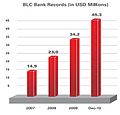 BankRecords.jpg 340 × 325; 24 KB
-
 BankRecs2.jpg 274 × 302; 19 KB
-
 Bar chart and magnifying glass.jpg 124 × 82; 3 KB
-
 Bar graph - economic statistics.jpg 1,084 × 459; 35 KB
-
 Beaufschlagungsdauer bis zum erreichen des grenzwertes grafik.png 1,546 × 846; 65 KB
-
 Bestallningar2009.png 385 × 246; 22 KB
-
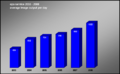
 BG epa service 2003-2008 average image output per day.png 977 × 600; 22 KB
-
 BG epa service 2003-2009 average image output per day.png 977 × 600; 24 KB
-
 BG epa service 2003-2010 average image output per day.png 977 × 600; 26 KB
-
 Bio fuel efficiency.jpg 500 × 256; 14 KB
-
 BTW05 1ho re ARD.jpg 895 × 652; 83 KB
-
 BTW05 ho re 2257 ARD.jpg 895 × 652; 138 KB
-
 BTW05 VAE CDU CSU Stapel.jpg 895 × 652; 146 KB
-
 BTW05 VAE CDU CSU.jpg 895 × 652; 138 KB
-
 Buenavista 2.jpg 419 × 267; 22 KB
-
 Calc4 - 2.png 1,024 × 768; 27 KB
-
 Cambios.png 332 × 360; 12 KB
-
 Cepfim10.JPG 690 × 433; 46 KB
-
 Cepfim11.JPG 703 × 442; 45 KB
-
 Cepfim12.JPG 683 × 439; 44 KB
-
 Cepfim13.JPG 678 × 195; 23 KB
-
 Cepfim5.JPG 705 × 420; 48 KB
-
 Cepfim6.JPG 685 × 420; 45 KB
-
 Cepfim7.JPG 685 × 428; 46 KB
-
 Cepfim8.JPG 689 × 433; 49 KB
-
 Cepfim9.JPG 696 × 434; 46 KB
-
 Cesariana comissao perinatal.png 1,177 × 679; 441 KB
-
 CH epa service 2003-2010 average image output per day.png 977 × 600; 25 KB
-
 Chart 3- time to productivity.jpg 960 × 720; 52 KB
-
 Chemiewaffenprogramm des Irak.png 610 × 550; 30 KB
-
 CHIN epa service 2003-2009 average image output per day.png 977 × 600; 23 KB
-
 CN epa service 2003-2008 average image output per day.png 977 × 600; 21 KB
-
 Der postmaterialistische Wertewandel 1970.png 835 × 499; 6 KB
-
 Dijagram1.jpg 268 × 257; 26 KB
-
 Dijagram2.jpg 533 × 328; 71 KB
-
 Distribucion de salvadoreños en el mundo.png 231 × 152; 18 KB
-
 Economic sectors and income cn.JPG 745 × 548; 59 KB
-
 Economic sectors and income.JPG 745 × 548; 43 KB
-
 EleccionesChile19892005.JPG 904 × 625; 75 KB
-
 EN epa service 2003-2009 average image output per day.png 977 × 600; 24 KB
-
 EN epa service 2003-2010 average image output per day.png 977 × 600; 27 KB
-
 EN epa service 2003-2011 average image output per day.png 814 × 600; 23 KB
-
 Energy table.JPG 628 × 298; 25 KB
-
 ENG epa service 2003-2010 average image output per day.png 977 × 600; 26 KB
-
 Epa service 2003-2008 average image output per day.PNG 977 × 600; 37 KB
-
 Evo colab aki.JPG 377 × 254; 12 KB
-
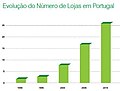 Evolucao lojas aki.JPG 368 × 278; 10 KB
-
 Evolucion-poblacion.png 878 × 289; 16 KB
-
 Expansão da cana de açucar.png 533 × 401; 87 KB
-
 Firearms export.png 537 × 433; 13 KB
-
 Foreclosure Trend.png 960 × 720; 24 KB
-
 Foreign languages Slovenia.jpg 690 × 463; 29 KB
-
 Foreign languages Éire.jpg 563 × 411; 26 KB
-
 FR epa service 2003-2009 average image output per day.png 977 × 600; 25 KB
-
 FR epa service 2003-2010 average image output per day.png 977 × 600; 26 KB
-
 Frequency of demonstratives.jpg 872 × 1,010; 210 KB
-
 Frequency of demonstratives2.jpg 872 × 1,010; 235 KB
-
 Frequency of demonstratives4.jpg 872 × 1,010; 231 KB
-
 GNE attendances.JPG 1,380 × 817; 61 KB
-
 Grafica.gif 277 × 177; 3 KB
-
 Grafik anggaran.JPG 1,217 × 672; 64 KB
-
 Grafyk behearsking Stellingwerfsk yn Weststellingwerf.PNG 720 × 382; 19 KB
-
 Graph bilan audit.JPG 832 × 443; 33 KB
-
 GraphOfHebrewWikipedia.JPG 656 × 271; 34 KB
-
 Handelsblattranking 2015.jpg 1,141 × 560; 82 KB
-
 Homweownership by race.jpg 525 × 317; 83 KB
-
 Image006enhancedcolor.gif 911 × 621; 36 KB
-

-
 Incisor cavities per thousand teeth increase with tooth age and sugar consumption.tif 2,835 × 1,970; 1.06 MB
-
 Internet pornography search terms stat.png 500 × 400; 5 KB
-
 Internet UA 2000-2013.png 1,323 × 994; 195 KB
-
 Interneti kasutajate hulk vanuseliselt protsentides.jpg 329 × 164; 11 KB
-
 IntifadaMurdered.png 430 × 271; 9 KB
-
 JP epa service 2003-2008 average image output per day.png 977 × 600; 22 KB
-
 JP epa service 2003-2009 average image output per day.png 977 × 600; 24 KB
-
 JP epa service 2003-2010 average image output per day.png 977 × 600; 25 KB
-
 KChart-screenshot2.png 802 × 635; 45 KB
-
 Ley de Schulz - Arnold o del Umbral.gif 593 × 232; 5 KB
-
 Lifetime Prevalence of Anxiety Disorders (ECA Study).jpg 618 × 475; 81 KB
-
 Ludność miasta Łodzi w latach 1985-2005.png 593 × 565; 124 KB
-
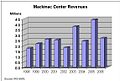 Mackinac Revenues 2.JPG 569 × 383; 34 KB
-
 Marzenia z M1.png 664 × 421; 49 KB
-
 McqStatsNov06.jpg 446 × 282; 56 KB
-
 Military Budget BIP.png 894 × 690; 33 KB
-
 Motivation profile.png 902 × 527; 39 KB
-
 MP3 compression.jpg 412 × 410; 39 KB
-
 MP3 compression.PNG 413 × 404; 39 KB
-
 Natural increase of Łódź in 1985-2005 (per 1000 population).png 594 × 565; 99 KB
-
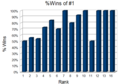 NCAA Wins Rank 1.png 600 × 420; 17 KB
-
 NCAA Wins-rank.png 600 × 420; 15 KB
-
 NL epa service 2003-2008 average image output per day.PNG 977 × 600; 23 KB
-
 NL epa service 2003-2009 average image output per day.png 977 × 600; 25 KB
-
 NL epa service 2003-2010 average image output per day.png 977 × 600; 27 KB
-
 NumAnt.png 484 × 274; 98 KB
-
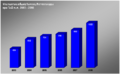
 Numbers of Soldiers in German South West Africa.jpg 1,044 × 681; 62 KB
-
 ODA 2009.png 814 × 521; 12 KB
-
 Oregon meth2008.gif 247 × 109; 2 KB
-
 Participacion de las exp en el pbi.JPG 568 × 247; 25 KB
-
 Personal pronouns2.jpg 1,257 × 1,198; 297 KB
-
 Personal pronouns3.jpg 1,257 × 1,198; 290 KB
-
 Personal pronouns4.jpg 1,257 × 1,198; 296 KB
-
 PL epa service 2003-2008 average image output per day.png 977 × 600; 23 KB
-
 PL epa service 2003-2009 average image output per day.png 977 × 600; 25 KB
-
 PL epa service 2003-2010 average image output per day.png 977 × 600; 26 KB
-
 Población por sexos.jpg 477 × 373; 40 KB
-
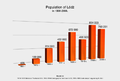 Population of Łódź in 1800-2006.png 836 × 565; 104 KB
-
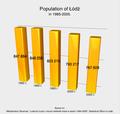 Population of Łódź in 1985-2005.png 593 × 565; 122 KB
-
 Population projection of Łódź 2010-2030.png 594 × 567; 120 KB
-

-
 Precipitations and average monthly air temperatures in Łódź in 2005.png 593 × 564; 131 KB
-
 Precipitations and average monthly air temperatures in Łódź in 2005.svg 593 × 564; 580 KB
-
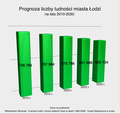 Prognoza liczby ludności miasta Łodzi na lata 2010-2030.png 594 × 566; 123 KB
-

-

-

-
 Race Income.png 400 × 301; 9 KB
-
 Radial8PartHeightLimatations.jpg 868 × 651; 56 KB
-
 Relaciones.jpg 442 × 245; 17 KB
-
 Remesas Honduras.jpg 1,030 × 738; 131 KB
-
 Repetition Rates in Primary School.png 504 × 203; 17 KB
-
 Resultado Votación sobre Coalición Pro Acceso.png 943 × 360; 53 KB
-
 Rezultati në Burrel.png 1,277 × 698; 26 KB
-
 Rezultati në Fier.png 1,277 × 698; 27 KB
-
 Rezultati në Kavajë.png 1,277 × 698; 25 KB
-
 Rezultati në Korçë.png 1,277 × 698; 28 KB
-
 Rezultati në Krujë.png 1,277 × 698; 26 KB
-
 Rezultati në Kukës.png 1,277 × 698; 25 KB
-
 Rezultati në Kuçovë.png 1,277 × 698; 24 KB
-
 Rezultati në Laç.png 1,277 × 698; 25 KB
-
 Rezultati në Lezhë.png 1,277 × 698; 24 KB
-
 Rezultati në Lushnje.png 1,277 × 698; 24 KB
-
 Rezultati në Patos.png 1,277 × 698; 24 KB
-
 Rezultati në Peshkopi.png 1,277 × 698; 27 KB
-
 Rezultati në Pogradec.png 1,277 × 698; 26 KB
-
 Rezultati në Sarandë.png 1,277 × 698; 26 KB
-
 Rezultati në Vlorë 2011.jpg 559 × 323; 27 KB
-
 Rezultati në Vlorë.png 1,277 × 698; 24 KB
-
 Rozwój demograficzny miasta Łodzi w latach 1800-2006.png 836 × 565; 109 KB
-
 RU epa service 2003-2009 average image output per day.png 977 × 600; 25 KB
-
 RU epa service 2003-2010 average image output per day.png 977 × 600; 26 KB
-
 SoderzanieQ10.jpg 864 × 346; 580 KB
-
 Sondaż 20.06.2006r. - Wykres.PNG 442 × 329; 10 KB
-
 Stemmen Beringen2012.jpg 680 × 500; 56 KB
-
 StemmenBocholt2012.jpg 680 × 500; 50 KB
-
 StemmenHam2012.jpg 680 × 500; 55 KB
-
 StemmenHamont-Achel2012.jpg 680 × 500; 54 KB
-
 StemmenHechtel-Eksel2012.jpg 680 × 500; 55 KB
-
 StemmenHouthalen-Helchteren2012.jpg 680 × 500; 61 KB
-
 StemmenLeopoldsburg2012.jpg 680 × 500; 59 KB
-
 StemmenLommel2012.jpg 680 × 500; 62 KB
-
 StemmenNeerpelt2012.jpg 680 × 500; 56 KB
-
 StemmenOvepelt2012.jpg 680 × 500; 58 KB
-
 StemmenPeer2012.jpg 680 × 500; 57 KB
-
 Studenci szkół wyższych (cywilnych) w Łodzi w latach 1975-2005.png 593 × 564; 97 KB
-
 Students of higher (civil) schools in Łódź in 1975-2005.png 593 × 564; 94 KB
-
 Switches domain.svg 735 × 527; 20 KB
-
 TH epa service 2003-2008 average image output per day.png 977 × 600; 23 KB
-
 TH epa service 2003-2009 average image output per day.png 977 × 600; 25 KB
-
 TH epa service 2003-2010 average image output per day.png 977 × 600; 26 KB
-
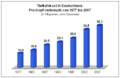 TK-Pro-Kopf-Verbrauch 1977-2007.png 571 × 370; 5 KB
-
 Transp.png 800 × 800; 14 KB
-
 Ukrainian parliamentary election, 2007 (ResultsByRegion).PNG 768 × 480; 15 KB
-
 Ukrainian parliamentary election, 2007 (SwingByRegion).PNG 767 × 477; 16 KB
-
 Ukrainian parliamentary election, 2007 (VoteByRegion).PNG 769 × 477; 16 KB
-
 Verkiezingen Tessenderlo.jpg 680 × 500; 54 KB
-
 Visifire.jpg 380 × 229; 19 KB
-
 Waldorf iskolák növekedése.png 677 × 525; 9 KB
-
 Waldorf schools growth.png 463 × 363; 10 KB
-
 Waldorf-schools-growth.png 677 × 525; 9 KB
-
 Where Cyberbullying Is Occuring-ar.jpg 506 × 325; 80 KB
-
 Where Cyberbullying Is Occuring.jpg 506 × 325; 35 KB
-
 WINWIKI-5.png 360 × 252; 22 KB
-
 Work UN.png 435 × 289; 8 KB


.jpg)


.png)


.png)


_w_%C5%81odzi_w_latach_1975-2005.png)
_schools_in_%C5%81%C3%B3d%C5%BA_in_1975-2005.png)


.PNG)
.PNG)
.PNG)


