Category:Valid SVG created with R
Jump to navigation
Jump to search
Subcategories
This category has only the following subcategory.
Media in category "Valid SVG created with R"
The following 183 files are in this category, out of 183 total.
-
 100 prisoners problem.svg 600 × 570; 70 KB
-
 2019-nCoV Cases.svg 512 × 410; 41 KB
-
 2019-nCoV in China.svg 512 × 410; 63 KB
-
 2019-nCoV in Wuhan.svg 512 × 410; 48 KB
-
 Acf.svg 217 × 289; 50 KB
-
 Al-Cu-spotprice.svg 720 × 540; 93 KB
-
 Al-spotprice1987-2012.svg 578 × 434; 11 KB
-
 Analemma.svg 900 × 990; 158 KB
-
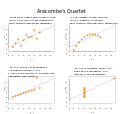 Anscombe with text.svg 1,000 × 950; 167 KB
-
 Anscombe's quartet 2.svg 990 × 752; 162 KB
-
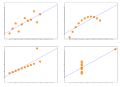 Anscombe's quartet.svg 990 × 720; 39 KB
-
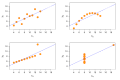 Anscombe.svg 945 × 630; 57 KB
-
 Antu application-x-object.svg 512 × 512; 1 KB
-
 Article Feedback Count Data.svg 900 × 564; 78 KB
-
 Australia-temp-anomaly-1910-2009.svg 720 × 540; 185 KB
-
 Balliol CollegeNorrington Ranking.svg 360 × 360; 57 KB
-
 Barchart linechart 01.svg 1,500 × 500; 10 KB
-
 Baringhead co2 v9.svg 720 × 540; 388 KB
-
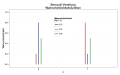 Bernoulli Distribution de.svg 749 × 468; 32 KB
-
 Beta-distribution.svg 563 × 375; 29 KB
-
 BetaBinomVsBinom.svg 593 × 533; 56 KB
-
 BinomialTest.svg 630 × 630; 35 KB
-
 Black cherry tree histogram no title.svg 216 × 216; 3 KB
-
 Bostonh hetres Heroskedastische Residuen.svg 450 × 450; 122 KB
-
 Bostonh hetres Lineare Regression.svg 450 × 450; 122 KB
-
 Bostonh hetres.svg 900 × 450; 347 KB
-
 Brasenose CollegeNorrington Ranking.svg 360 × 360; 58 KB
-
 C control chart.svg 630 × 629; 39 KB
-
 Canterbury Regional Council Consent Applications Backlog.svg 614 × 477; 143 KB
-
 Capacidad por fuente Colombia 2005.svg 720 × 720; 17 KB
-
 Car stopping distances-1920.svg 723 × 578; 12 KB
-
 Cers-pie-Oct-2012.svg 578 × 578; 7 KB
-
 Christ ChurchNorrington Ranking.svg 360 × 360; 58 KB
-
 CLTBinomConvergence.svg 1,012 × 650; 33 KB
-
 Corpus Christi CollegeNorrington Ranking.svg 360 × 360; 60 KB
-
 Cristallisation-chocolat.svg 540 × 540; 46 KB
-
 Czechia believers 2021 census.svg 2,109 × 596; 85 KB
-
 DelaportePMF.svg 515 × 421; 53 KB
-
 Ee real gdp growth.svg 1,350 × 900; 44 KB
-
 ErlangDichteF.svg 723 × 578; 12 KB
-
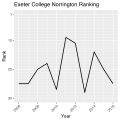 Exeter CollegeNorrington Ranking.svg 360 × 360; 56 KB
-
 ExpDichteF.svg 506 × 506; 9 KB
-
 ExpVerteilungF.svg 506 × 506; 9 KB
-
 Fi real gdp growth.svg 1,350 × 900; 42 KB
-
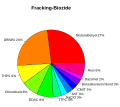 Fracbiozide.svg 672 × 600; 54 KB
-

-
 Genome size vs number of genes.svg 1,350 × 900; 1.74 MB
-
 Genome size vs protein count.svg 512 × 512; 11.02 MB
-
 GermanyUnemploymentRate.svg 990 × 630; 60 KB
-
 Graph comparing article edits on Wikivoyage and Wikitravel.svg 585 × 405; 80 KB
-
 GumbelDichteF.svg 723 × 578; 16 KB
-
 Halton sequence 2D.svg 289 × 289; 37 KB
-
 Harnstoffpreis.svg 720 × 540; 76 KB
-
 Harris Manchester CollegeNorrington Ranking.svg 360 × 360; 60 KB
-
 Haukilahti population.svg 720 × 435; 56 KB
-
-
 Hertford CollegeNorrington Ranking.svg 360 × 360; 58 KB
-
 Hexenanklagen Herzogtum Westfalen 1508–1732 logscale.svg 1,260 × 630; 83 KB
-
 Hexenanklagen Herzogtum Westfalen 1508–1732.svg 1,260 × 630; 79 KB
-
 Histogram example.svg 361 × 289; 6 KB
-
 Histogram of arrivals per minute.svg 614 × 520; 175 KB
-
 Histogram4.svg 630 × 630; 75 KB
-
 Individuals chart for a paired individuals and MR chart.svg 630 × 629; 42 KB
-
 Ingressos pressupost CCMA 2017.svg 347 × 301; 8 KB
-
 Inhomogeneouspoissonprocess.svg 603 × 415; 38 KB
-
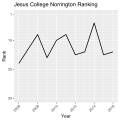 Jesus CollegeNorrington Ranking.svg 360 × 360; 58 KB
-
 Kakapo-population-size.svg 487 × 374; 77 KB
-
 Kapuni-m3.svg 578 × 434; 6 KB
-
 Keble CollegeNorrington Ranking.svg 360 × 360; 57 KB
-
 Kernel density.svg 250 × 200; 42 KB
-
 Kyoto-Related Fossil-Fuel Carbon Dioxide Emissions 1990-2007.svg 578 × 434; 13 KB
-
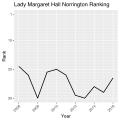 Lady Margaret HallNorrington Ranking.svg 360 × 360; 58 KB
-
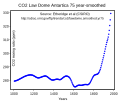 Lawdome75yrco2.svg 506 × 434; 32 KB
-
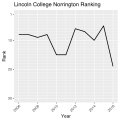 Lincoln CollegeNorrington Ranking.svg 360 × 360; 57 KB
-
 LogBase10.svg 145 × 145; 8 KB
-
 Logit-probit.svg 630 × 630; 37 KB
-
 Magdalen CollegeNorrington Ranking.svg 360 × 360; 57 KB
-
 Mansfield CollegeNorrington Ranking.svg 360 × 360; 59 KB
-
 Mauna Loa CO2 monthly mean concentration DE.svg 708 × 708; 438 KB
-
 Mauna Loa CO2 monthly mean concentration FR.svg 708 × 708; 439 KB
-
 Mauna Loa CO2 monthly mean concentration NL.svg 708 × 708; 436 KB
-
 Mauna Loa CO2 monthly mean concentration NO.svg 708 × 708; 441 KB
-
 Mauna Loa CO2 monthly mean concentration PL.svg 708 × 708; 442 KB
-
 Mauna Loa CO2 monthly mean concentration RO.svg 708 × 708; 438 KB
-
 Mauna Loa CO2 monthly mean concentration RU.svg 708 × 708; 451 KB
-
 Mauna Loa CO2 monthly mean concentration-ca.svg 708 × 708; 438 KB
-
 Mauna Loa CO2 monthly mean concentration-es.svg 708 × 708; 434 KB
-
 Mauna Loa CO2 monthly mean concentration.svg 708 × 708; 434 KB
-
 Mauna Loa CO2 monthly mean concentrationCS.svg 708 × 708; 447 KB
-
 Merton CollegeNorrington Ranking.svg 360 × 360; 56 KB
-
 Michelsonmorley-boxplot.svg 432 × 432; 11 KB
-
 Mobile Uploads – Lupo's logs.SVG 1,260 × 630; 63 KB
-
 MR chart for a paired individuals and MR chart.svg 630 × 629; 38 KB
-
 Multilateral environmental treaties-by-decennium-subject-de.svg 484 × 375; 96 KB
-
 Multilateral environmental treaties-by-decennium-subject-en.svg 484 × 375; 87 KB
-
 Multilateral environmental treaties-by-year-and-type-en.svg 484 × 375; 84 KB
-
 Multilateral environmental treaties-by-year-and-type.svg 484 × 375; 87 KB
-
 New CollegeNorrington Ranking.svg 360 × 360; 56 KB
-
 New Zealand Greenhouse Gas Emissions 1990 to 2017.svg 768 × 576; 161 KB
-
 New Zealand Observed Electricity Consumption Sector.svg 552 × 401; 9 KB
-
 New Zealand overseas debt 1993-2010.svg 720 × 540; 91 KB
-
 Niittykumpu population.svg 720 × 435; 54 KB
-
 Northern Hemisphere Azimuthal projections.svg 677 × 689; 1.19 MB
-
 Np control chart.svg 630 × 629; 38 KB
-
 NZ Electricity Generation.svg 552 × 402; 16 KB
-
 NZ Energy 2008.svg 564 × 477; 5 KB
-
 NZ greenhouse gases by sector.svg 720 × 540; 143 KB
-
 NZ Gross GhG Emissions 1861 to 2012.svg 720 × 540; 74 KB
-
 NZ-best-land-temp-anom.svg 720 × 540; 137 KB
-
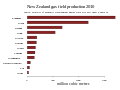
 NZ-ghg-2010-720by540.svg 720 × 540; 128 KB
-
 NZ-ghg-2012-720by540.svg 720 × 540; 84 KB
-
 Nzgasfield.svg 578 × 434; 5 KB
-
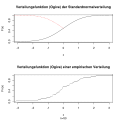 Ogive.svg 630 × 630; 76 KB
-

-
 Oriel CollegeNorrington Ranking.svg 360 × 360; 56 KB
-
 P control chart.svg 630 × 629; 38 KB
-
 Pareto chart of titanium investment casting defects.svg 614 × 623; 25 KB
-
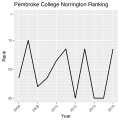 Pembroke CollegeNorrington Ranking.svg 360 × 360; 58 KB
-
 Percentage of Order of Australia honours to women.svg 750 × 525; 86 KB
-
 Piechart.svg 703 × 321; 13 KB
-
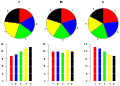 Piecharts.svg 689 × 494; 39 KB
-
 Polacy w Hadze.svg 720 × 540; 58 KB
-
 Population of Estonia.svg 540 × 450; 25 KB
-
 PromotorsK01589 logo 1.svg 1,200 × 1,200; 49 KB
-
 Quantile graph.svg 1,355 × 903; 705 KB
-
 R chart for a paired xbar and R chart.svg 630 × 629; 34 KB
-
 R-cars log lowess example.svg 360 × 360; 67 KB
-
 R-horsekick totals-density.svg 360 × 225; 74 KB
-
 R-US state areas-basicboxplot.svg 450 × 135; 64 KB
-
 R-US state areas-density.svg 360 × 225; 70 KB
-
 R-US state areas-hist+dens sqrt.svg 450 × 270; 81 KB
-
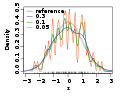
 Rating count density by project quality assessment.svg 796 × 564; 167 KB
-
 Reg ls curvilínia.svg 630 × 630; 46 KB
-
 Reg ls qq edat pad.svg 630 × 630; 69 KB
-
 Reg ls sin2.svg 630 × 630; 42 KB
-
 S chart for a paired xbar and s chart.svg 630 × 629; 35 KB
-
 Scaled chi squared cdf.svg 270 × 270; 52 KB
-
 Scaled chi squared.svg 270 × 270; 54 KB
-
 Scaled inverse chi squared cdf.svg 270 × 270; 49 KB
-
 Sealevel-rise 1870-2009 de.svg 610 × 518; 113 KB
-
 Simple barplot.svg 723 × 578; 3 KB
-
 Somerville CollegeNorrington Ranking.svg 360 × 360; 58 KB
-
 SovCDS-rating de.svg 702 × 540; 155 KB
-
 St Anne's CollegeNorrington Ranking.svg 360 × 360; 59 KB
-
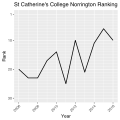 St Catherine's CollegeNorrington Ranking.svg 360 × 360; 60 KB
-
 St Edmund HallNorrington Ranking.svg 360 × 360; 58 KB
-
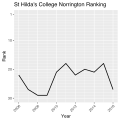 St Hilda's CollegeNorrington Ranking.svg 360 × 360; 60 KB
-
 St Hugh's CollegeNorrington Ranking.svg 360 × 360; 60 KB
-
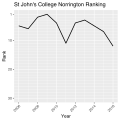 St John's CollegeNorrington Ranking.svg 360 × 360; 60 KB
-
 St Peter's CollegeNorrington Ranking.svg 360 × 360; 59 KB
-
 Standard deviation diagram.svg 400 × 200; 17 KB
-
 Streckgrenze PV Wochentage.svg 698 × 473; 40 KB
-
 Taxa de perill malalts amb sida.svg 630 × 630; 59 KB
-
 Temp anomalies 2000yrs pages2k-de.svg 1,065 × 425; 4.81 MB
-
 Temp anomalies 2000yrs pages2k-en.svg 1,065 × 425; 4.8 MB
-
 The Queen's CollegeNorrington Ranking.svg 360 × 360; 60 KB
-
 Tiefkühlkonsum.svg 760 × 580; 9 KB
-
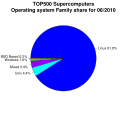 TOP500 operating system family share.svg 630 × 630; 61 KB
-
 Trinity CollegeNorrington Ranking.svg 360 × 360; 57 KB
-
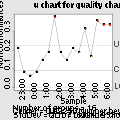 U control chart.svg 630 × 629; 39 KB
-
 UK Debt as percentage of GDP.svg 643 × 335; 93 KB
-
-
 University CollegeNorrington Ranking.svg 360 × 360; 59 KB
-
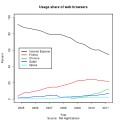 Usage share of web browsers (Source Net Applications).svg 630 × 630; 52 KB
-
 Usage share of web browsers (Source StatCounter).svg 1,260 × 630; 79 KB
-
 Vendanges france 1892-2014 en US.svg 1,041 × 644; 325 KB
-
 Wadham CollegeNorrington Ranking.svg 360 × 360; 59 KB
-
 Web browser usage share.svg 630 × 630; 47 KB
-
 Winter-NAO-Index-DE.svg 566 × 351; 158 KB
-
 Winter-NAO-Index-FR.svg 566 × 351; 159 KB
-
 Winter-NAO-Index-IT.svg 566 × 351; 153 KB
-
 Winter-NAO-Index.svg 566 × 351; 154 KB
-
 Wollepreis AWEX.svg 720 × 540; 89 KB
-
 Worcester CollegeNorrington Ranking.svg 360 × 360; 58 KB
-
 Xbar chart for a paired xbar and R chart.svg 630 × 629; 37 KB
-
 Xbar chart for a paired xbar and s chart.svg 630 × 629; 43 KB
-
 YouTube Rewind 2018 and Baby dislikes.svg 672 × 672; 8 KB
-
 Zuckerpreis 1991.svg 720 × 540; 68 KB
-
 Évolution des dates de vendanges en France (1892-2014).svg 1,041 × 644; 334 KB
-
 Česko vyznání, sčítání 2021.svg 2,109 × 596; 95 KB
-
 中国境内新型冠状病毒感染的肺炎疫情报告.svg 512 × 410; 1.38 MB
-
 中国湖北武汉新型冠状病毒感染的肺炎疫情报告.svg 512 × 410; 1.76 MB
-
 全球新型冠状病毒感染的肺炎疫情报告.svg 512 × 410; 1,010 KB


.svg)


.svg)

.svg)
.svg)


.svg)


