Category:Valid SVG created with Inkscape:Charts
Jump to navigation
Jump to search
Subcategories
This category has the following 3 subcategories, out of 3 total.
Media in category "Valid SVG created with Inkscape:Charts"
The following 200 files are in this category, out of 202 total.
(previous page) (next page)-
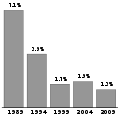
%NoInsurance.svg 675 × 413; 28 KB
-
1 ipcc 5th report economic sector impact on environment en.svg 926 × 501; 114 KB
-
18. Deutscher Bundestag nach beruflicher Herkunft.svg 1,132 × 642; 19 KB
-
1851- U.S. landfall hurricanes by month.svg 900 × 600; 1 KB
-
1929- Advertising revenue as percent of GDP (US).svg 1,200 × 850; 21 KB
-
1961 federal german result.svg 540 × 250; 7 KB
-
1965 federal german result.svg 500 × 250; 6 KB
-
1969 federal german result.svg 485 × 255; 5 KB
-
1971 Launches.svg 302 × 302; 7 KB
-
1976 federal german result.svg 485 × 250; 5 KB
-
1980 federal german results.svg 485 × 255; 5 KB
-
1980 Launches.svg 302 × 302; 6 KB
-
1983 federal german result.svg 490 × 255; 6 KB
-
1987 federal german result.svg 500 × 255; 6 KB
-
1990 federal german result.svg 500 × 250; 7 KB
-
1994 federal german result.svg 500 × 255; 7 KB
-
1994 Northridge earthquake.svg 618 × 343; 1.32 MB
-
1998 federal german result.svg 495 × 255; 7 KB
-
2 ipcc 5th report economic sector impact on environment ptbr.svg 926 × 501; 125 KB
-
2-3 strom - odebrani prvku3.svg 576 × 408; 18 KB
-
2002 federal german result.svg 495 × 256; 7 KB
-
2004 Format.svg 1,038 × 1,141; 4 KB
-
2008 IPL Final Manhattan.svg 1,400 × 1,200; 47 KB
-
2008 UK Book Sales Volume.svg 1,130 × 1,006; 8 KB
-
2010 Launches.svg 302 × 302; 8 KB
-
2011 calendar.svg 744 × 1,052; 126 KB
-
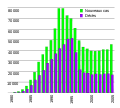
2011 Drug Harms Rankings fr.svg 790 × 570; 51 KB
-
2011 Launches.svg 302 × 302; 7 KB
-
2012 Launches.svg 302 × 302; 7 KB
-
2013 Launches.svg 302 × 302; 7 KB
-
2014 Launches.svg 302 × 302; 7 KB
-
2015 PM2.5 Air Quality Index in Seoul.svg 926 × 373; 5.35 MB
-
2020 coronavirus quarantine in China.svg 659 × 429; 40 KB
-
2024 Portuguese election polls.svg 1,800 × 900; 189 KB
-
32-column periodic table-a.svg 2,142 × 622; 478 KB
-
3d-cmos-loss-diagram.svg 564 × 449; 805 KB
-
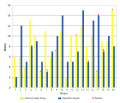
AB de Villiers ODI batting graph with 10-innings average.svg 3,440 × 2,120; 183 KB
-
AB de Villiers ODI batting graph.svg 3,440 × 2,120; 192 KB
-
AB de Villiers Test batting graph with 10-innings average.svg 3,520 × 2,640; 191 KB
-
AB de Villiers Test batting graph.svg 3,520 × 2,640; 199 KB
-
Action potential (no labels).svg 491 × 485; 6 KB
-
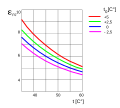
Ads isothermen.svg 744 × 531; 23 KB
-
AidsstatUSA-fr.svg 631 × 569; 33 KB
-
Alkanschmelzundsiedepunkt.svg 900 × 592; 94 KB
-
Alphabet haufigkeit.svg 800 × 500; 443 KB
-
Ammonium nitrate water phase diagram.svg 690 × 496; 842 KB
-
Annuity 0001.svg 744 × 200; 11 KB
-
Anzahl der (Super)Reichen 2007.svg 842 × 573; 14 KB
-
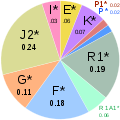
ArmenianHaplogroups.svg 304 × 304; 18 KB
-
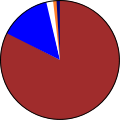
Asamblea Caquetá 2012-2015.svg 587 × 327; 17 KB
-
Asamblea Nacional de Ecuador 2009.svg 900 × 700; 284 KB
-
Atlantic ace timeseries 1850-2007 fr.svg 850 × 550; 61 KB
-
Atlantic ace timeseries 1850-2016 fr.svg 850 × 550; 28 KB
-
Autonomous decentralised system architecture schematic.svg 416 × 337; 16 KB
-
Axes tephigramme.svg 700 × 820; 39 KB
-
Bayern Landtagswahl 2008.svg 1,723 × 1,000; 1.09 MB
-
Beta Energiespektrum.svg 457 × 299; 41 KB
-
BMI as.svg 945 × 525; 30 KB
-
BMI ca.svg 945 × 525; 27 KB
-
BMI cs.svg 945 × 525; 29 KB
-
BMI de.svg 945 × 525; 30 KB
-
BMI en-mr.svg 945 × 525; 30 KB
-
BMI en.svg 940 × 520; 5 KB
-
BMI es.svg 945 × 525; 25 KB
-
BMI fi.svg 945 × 525; 26 KB
-
BMI fr.svg 945 × 525; 30 KB
-
BMI grid ar.svg 945 × 525; 32 KB
-
BMI grid ca.svg 945 × 525; 32 KB
-
BMI grid cs.svg 945 × 525; 32 KB
-
BMI grid en.svg 940 × 520; 2 KB
-
BMI grid es.svg 945 × 525; 32 KB
-
BMI grid fi.svg 945 × 525; 32 KB
-
BMI grid fr.svg 945 × 525; 34 KB
-
BMI grid it.svg 945 × 525; 32 KB
-
BMI grid nb.svg 945 × 525; 32 KB
-
BMI grid sv.svg 945 × 525; 32 KB
-
BMI it.svg 945 × 525; 26 KB
-
BMI mk.svg 945 × 525; 164 KB
-
BMI ml.svg 1,008 × 560; 36 KB
-
BMI nb.svg 945 × 525; 30 KB
-
BMI pl.svg 945 × 525; 30 KB
-
BMI te.svg 945 × 525; 32 KB
-
BMI-bn.svg 945 × 525; 30 KB
-
BMI-gu.svg 945 × 525; 29 KB
-
BMI-hi.svg 945 × 525; 30 KB
-
BMI-pa.svg 945 × 525; 30 KB
-
BodyMassIndex.svg 479 × 300; 32 KB
-
Brachial plexus color (vi).svg 982 × 403; 59 KB
-
Brachial plexus color.svg 982 × 403; 59 KB
-
Bsd distributions usage.svg 301 × 431; 8 KB
-
Cape Town water crisis graph.svg 1,264 × 362; 25 KB
-
Carrigan's model of Beowulf's Design.svg 739 × 446; 24 KB
-
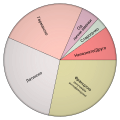
CO2 emission pie chartCZ.svg 540 × 540; 20 KB
-
Cognitive Functions.svg 512 × 512; 64 KB
-
Cone-response-de(2).svg 550 × 346; 16 KB
-
CPT-Sound-SamplingQ1.svg 585 × 335; 14 KB
-
CPT-Sound-SamplingQ2.svg 585 × 335; 12 KB
-
CPT-Structured-Chart-Q1.svg 577 × 368; 12 KB
-
Cámara de los Comunes Reino Unido 2010.svg 1,670 × 794; 523 KB
-
D-BW-Kressbronn aB - Einwohnerentwicklung.svg 800 × 600; 87 KB
-
Diamond inheritance.svg 180 × 270; 3 KB
-
Divisionale Organisation.svg 629 × 174; 21 KB
-
Earth cross section (Japanese).svg 517 × 457; 184 KB
-
EKFK.svg 579 × 123; 448 KB
-
Elecciones Octubre de 2003 Asamblea de Madrid.svg 199 × 100; 10 KB
-
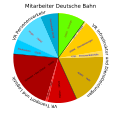
Employees Deutsche Bahn.svg 1,160 × 1,103; 105 KB
-
Erroneous golden angle pie chart.svg 230 × 227; 3 KB
-
Evolved Packet Core Diagram.svg 955 × 348; 8 KB
-
Festigkeit von Fasern.svg 1,038 × 826; 28 KB
-
French coal consumption by sector-fr.svg 1,055 × 572; 34 KB
-
HeatpumpCOP.svg 1,000 × 900; 19 KB
-
Histogram of arrivals per minute.svg 614 × 520; 175 KB
-
HSV-RGB-comparison.svg 451 × 331; 12 KB
-
Hypothalamus-Hypophysis-Testicle-Hormone-Axis.svg 693 × 433; 19 KB
-
Idea analizy B numeru.svg 580 × 150; 106 KB
-
Inflation graph argentina.svg 425 × 315; 36 KB
-
Infrastruktura Wspomagajaca USSD.svg 740 × 280; 27 KB
-
Instrumental Temperature RecordTamil.svg 650 × 650; 125 KB
-
Integration der ISO 639 Sprachcodes.svg 760 × 520; 33 KB
-
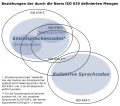
ISO 639 Mengenbeziehungen.svg 500 × 440; 14 KB
-
ISO 639 Schematische Darstellung.svg 720 × 380; 17 KB
-
ISO 8601 explanation.svg 1,536 × 2,113; 122 KB
-
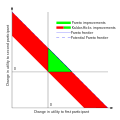
Kaldor-Hicks-en.svg 500 × 500; 11 KB
-
Kaldor-Hicks-fr.svg 500 × 500; 11 KB
-
Lake effect deltat chart.svg 738 × 1,596; 108 KB
-
Leistung-BlindKom.svg 620 × 320; 55 KB
-
Local government in Balassagyarmat (1994).svg 704 × 354; 3 KB
-
Local government in Balassagyarmat (1998).svg 704 × 354; 3 KB
-
Local government in Balassagyarmat (2002).svg 704 × 354; 3 KB
-
Mammal species pie chart.svg 482 × 482; 19 KB
-
Medellin Kartell.svg 788 × 478; 6 KB
-
Metody dezodoryizacji.svg 1,227 × 703; 261 KB
-
MobileBitRate-logScale.svg 512 × 229; 16 KB
-
MonolithicArchitececture CS CoreNetwork3GPP.svg 640 × 300; 23 KB
-
Monty problem monte carlo tr.svg 583 × 247; 257 KB
-
Monty problem monte carlo.svg 583 × 247; 257 KB
-
MRSI-trajectories.svg 433 × 327; 25 KB
-
MWPC electric field.svg 270 × 360; 18 KB
-
Myopia rate in Europe by birth decade - fr.svg 567 × 319; 19 KB
-
Myopia rate in Europe by birth decade.svg 567 × 319; 19 KB
-
Narody chorwacji.svg 744 × 574; 16 KB
-
Nutzer Barchart WhatsApp in Deutschland.svg 800 × 500; 20 KB
-
Okun's law Japan.svg 1,811 × 850; 230 KB
-
Origins of English PieChart 2D mk.svg 600 × 600; 75 KB
-
Paccheto d'onda.svg 828 × 583; 10 KB
-
Park Geun-hye Approval ratings by age.svg 926 × 477; 24 KB
-
Park Geun-hye Presidential Approval Rating.svg 618 × 385; 72 KB
-
Parlamento Alemania 1949.svg 1,369 × 644; 197 KB
-
Phasenanschnitt Beispiel.svg 300 × 200; 11 KB
-
Philippine party-list elections.svg 920 × 671; 21 KB
-
Photogrammetry Wiora EN.svg 416 × 246; 14 KB
-
Pie chart EP election 2004.svg 744 × 574; 8 KB
-
Pie chart of lung cancers zh-hant.svg 482 × 368; 20 KB
-
Pipeline Niagara.svg 700 × 450; 36 KB
-
Plan marshall.svg 590 × 954; 31 KB
-
Population - Municipality code 07090.svg 475 × 355; 13 KB
-
PraefixCodeBaum.svg 275 × 283; 10 KB
-
Presocratic graph EL.svg 2,177 × 1,133; 76 KB
-
Primary cells specific energy.svg 375 × 250; 10 KB
-
Przeciążenie w fazie startu - wahadłowiec.svg 687 × 591; 9 KB
-
Race and ethnicity in the United States Census, 2010 - ru.svg 1,100 × 454; 47 KB
-
Rainbow table1.svg 700 × 270; 53 KB
-
Reformed Scots Church Denominations.svg 2,527 × 994; 83 KB
-
Regenerative Rankine Cycle Mixing1 T-sChart.svg 638 × 496; 90 KB
-
Regenerative Rankine Cycle Mixing3 T-sChart.svg 638 × 496; 144 KB
-
Regenerative Rankine Cycle Surface3 T-sChart.svg 638 × 496; 147 KB
-
Regenerative Rankine Cycle Surface3 T-sChart2.svg 638 × 496; 149 KB
-
Regenerative Rankine Cycle Surface3 T-sChart3.svg 638 × 496; 147 KB
-
Regenerative Rankine Cycle T-s Chart.svg 638 × 496; 77 KB
-
Regenerative Rankine Cycle TsChart.svg 638 × 496; 74 KB
-
Reheated Rankine Cycle T-s Chart.svg 638 × 496; 76 KB
-
Reheated Rankine Cycle TsChart.svg 638 × 496; 76 KB
-
Reheated-Regenerative Rankine Cycle T-s Chart.svg 638 × 496; 94 KB
-
Reheated-Regenerative Rankine Cycle TsChart.svg 638 × 496; 94 KB
-
REP Europawahlen.svg 993 × 972; 6 KB
-
Rindler chart2.svg 512 × 966; 319 KB
-
Roguetree2.svg 821 × 1,086; 32 KB
-
Russian Total Fertility Rates - ru.svg 1,500 × 950; 114 KB
-
Schärfeeindruck.svg 805 × 273; 76 KB
-
SHA-1.svg 365 × 380; 36 KB
-
Simple Periodic Table Chart-en.svg 1,205 × 638; 16 KB
-
Simple rainbow table.svg 700 × 270; 55 KB
-
Simple Rankine Cycle T-s Chart.svg 638 × 496; 57 KB
-
Simple Rankine Cycle TsChart.svg 638 × 496; 57 KB
-
Stateofthecommons2017-o.svg 354 × 484; 49 KB
-
TechnicalInteroperableIntegrationOfSpatialData.svg 599 × 384; 9 KB
-
Temperature-entropy chart of a superheated, reheated Rankine cycle.svg 1,396 × 1,127; 23 KB
-
Template location map.svg 7,200 × 3,600; 819 KB
-
Tollefsen2013Chart.svg 1,000 × 800; 228 KB
-
Top Wikipedians compared to the rest of the community, November 2012.svg 1,654 × 1,279; 140 KB
-
Total initiatives.svg 757 × 518; 154 KB
-
Traffico frejus 1950-2030.svg 617 × 436; 49 KB
-
Ueberlebenskurve 02.svg 667 × 563; 98 KB
-
Unicode Web growth.svg 646 × 368; 27 KB
-
Utica population history 2010.svg 1,361 × 934; 45 KB
-
Verbreitung der SARS-CoV-2-Virusvarianten in Deutschland.svg 5,730 × 3,222; 102 KB
-
VOC-Anteile Deutschland 1990 2003.svg 460 × 311; 9 KB
-
Wikipedia editors are predominantly male KO.svg 550 × 279; 30 KB
-
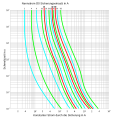
Zeit-Strom-Kennlinien D0-NEOZED IEC60269.svg 820 × 860; 66 KB


