Category:Valid SVG created with Gnuplot:Climate diagrams
Jump to navigation
Jump to search
Media in category "Valid SVG created with Gnuplot:Climate diagrams"
The following 200 files are in this category, out of 465 total.
(previous page) (next page)-
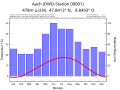 Klimadiagramm Aach DWD 00001 Jahre 1956-1986.svg 800 × 600; 30 KB
-
 Klimadiagramm Aachen DWD 00003 Jahre 1981-2011.svg 800 × 600; 35 KB
-
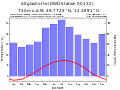
 Klimadiagramm Aldersbach-Kriestorf DWD 00073 Jahre 1985-2015.svg 800 × 600; 30 KB
-
 Klimadiagramm Alfhausen DWD 00078 Jahre 1987-2016.svg 800 × 600; 34 KB
-
 Klimadiagramm Altglashütte DWD 00132 Jahre 1957-1987.svg 800 × 600; 30 KB
-
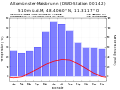 Klimadiagramm Altomünster-Maisbrunn DWD 00142 Jahre 1985-2015.svg 800 × 600; 31 KB
-
 Klimadiagramm Alzey DWD 00150 Jahre 1957-1987.svg 800 × 600; 31 KB
-
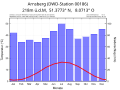
 Klimadiagramm Amberg-Unterammersricht DWD 00151 Jahre 1987-2016.svg 800 × 600; 28 KB
-
 Klimadiagramm Angermünde DWD 00164 Jahre 1987-2016.svg 800 × 600; 34 KB
-
 Klimadiagramm Annaberg-Buchholz DWD 00169 Jahre 1917-1946.svg 800 × 600; 30 KB
-
 Klimadiagramm Ansbach DWD 00175 Jahre 1921-1951.svg 800 × 600; 35 KB
-
 Klimadiagramm Arkona DWD 00183 Jahre 1987-2016.svg 800 × 600; 32 KB
-
 Klimadiagramm Arnsberg DWD 00186 Jahre 1968-1998.svg 800 × 600; 30 KB
-
 Klimadiagramm Arolsen-Neu Berich DWD 00193 Jahre 1938-1938.svg 800 × 600; 35 KB
-
 Klimadiagramm Artern DWD 00198 Jahre 1987-2016.svg 800 × 600; 34 KB
-
 Klimadiagramm Attenkam DWD 00217 Jahre 1987-2016.svg 800 × 600; 34 KB
-
 Klimadiagramm Augsburg (Sankt Stephan) DWD 00231 Jahre 1944-1974.svg 800 × 600; 31 KB
-
 Klimadiagramm Augsburg DWD 00232 Jahre 1987-2016.svg 800 × 600; 30 KB
-
 Klimadiagramm Aulendorf-Haslach DWD 07135 Jahre 1975-2004.svg 800 × 600; 31 KB
-
 Klimadiagramm Aurich DWD 00243 Jahre 1977-2006.svg 800 × 600; 35 KB
-
 Klimadiagramm Baden-Baden-Geroldsau DWD 00257 Jahre 1986-2016.svg 800 × 600; 31 KB
-
 Klimadiagramm Bamberg (Sternwarte) DWD 00284 Jahre 1928-1958.svg 800 × 600; 35 KB
-
 Klimadiagramm Bamberg DWD 00282 Jahre 1987-2016.svg 800 × 600; 35 KB
-
 Klimadiagramm Bederkesa DWD 00327 Jahre 1966-1996.svg 800 × 600; 30 KB
-
 Klimadiagramm Beerfelden DWD 00330 Jahre 1982-2012.svg 800 × 600; 30 KB
-
 Klimadiagramm Bensheim DWD 00355 Jahre 1959-1989.svg 800 × 600; 35 KB
-
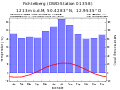
 Klimadiagramm Berchtesgaden (KKst) DWD 00361 Jahre 1917-1947.svg 800 × 600; 29 KB
-
 Klimadiagramm Berge DWD 05825 Jahre 1961-1991.svg 800 × 600; 32 KB
-
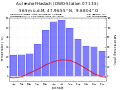
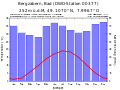 Klimadiagramm Bergzabern, Bad DWD 00377 Jahre 1978-2008.svg 800 × 600; 34 KB
-
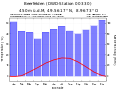
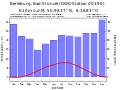 Klimadiagramm Berleburg, Bad-Stünzel DWD 00390 Jahre 1987-2016.svg 800 × 600; 31 KB
-
 Klimadiagramm Berlin-Buch DWD 00400 Jahre 1966-1996.svg 800 × 600; 34 KB
-
 Klimadiagramm Berlin-Dahlem (FU) DWD 00403 Jahre 1987-2016.svg 800 × 600; 32 KB
-
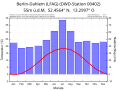 Klimadiagramm Berlin-Dahlem (LFAG) DWD 00402 Jahre 1915-1945.svg 800 × 600; 35 KB
-
 Klimadiagramm Berlin-Schönefeld DWD 00427 Jahre 1987-2016.svg 800 × 600; 34 KB
-
 Klimadiagramm Berlin-Tegel DWD 00430 Jahre 1987-2016.svg 800 × 600; 32 KB
-
 Klimadiagramm Berlin-Tempelhof DWD 00433 Jahre 1987-2016.svg 800 × 600; 32 KB
-
 Klimadiagramm Berlin-Zehlendorf DWD 00435 Jahre 1977-2006.svg 800 × 600; 34 KB
-
 Klimadiagramm Bernburg Saale (Nord) DWD 00445 Jahre 1987-2016.svg 800 × 600; 32 KB
-
 Klimadiagramm Bernkastel-Kues DWD 00450 Jahre 1976-2006.svg 800 × 600; 34 KB
-
 Klimadiagramm Berus DWD 00460 Jahre 1976-2006.svg 800 × 600; 35 KB
-
 Klimadiagramm Biedenkopf-Wallau DWD 00480 Jahre 1977-2006.svg 800 × 600; 30 KB
-
 Klimadiagramm Birx Rhön DWD 01411 Jahre 1896-1926.svg 800 × 600; 30 KB
-
 Klimadiagramm Bischbrunn DWD 00502 Jahre 1977-2006.svg 800 × 600; 30 KB
-
 Klimadiagramm Blankenrath DWD 00535 Jahre 1978-2008.svg 800 × 600; 34 KB
-
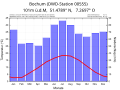 Klimadiagramm Bochum DWD 00555 Jahre 1931-1961.svg 800 × 600; 35 KB
-
 Klimadiagramm Boizenburg DWD 00591 Jahre 1962-1992.svg 800 × 600; 34 KB
-
 Klimadiagramm Boltenhagen DWD 00596 Jahre 1985-2015.svg 800 × 600; 32 KB
-
 Klimadiagramm Bonn-Friesdorf DWD 00599 Jahre 1957-1986.svg 800 × 600; 34 KB
-
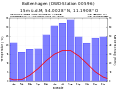
 Klimadiagramm Borkum-Süderstraße DWD 00619 Jahre 1948-1977.svg 800 × 600; 34 KB
-
 Klimadiagramm Brande-Hörnerkirchen DWD 00648 Jahre 1977-2006.svg 800 × 600; 35 KB
-
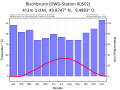
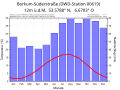
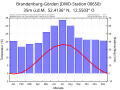 Klimadiagramm Brandenburg-Görden DWD 00650 Jahre 1961-1990.svg 800 × 600; 34 KB
-
 Klimadiagramm Braunlage DWD 00656 Jahre 1975-2005.svg 800 × 600; 32 KB
-
 Klimadiagramm Braunschweig (T.H.) DWD 00661 Jahre 1894-1924.svg 800 × 600; 35 KB
-
 Klimadiagramm Braunschweig DWD 00662 Jahre 1987-2016.svg 800 × 600; 32 KB
-
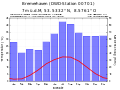
 Klimadiagramm Bremen DWD 00691 Jahre 1987-2016.svg 800 × 600; 34 KB
-
 Klimadiagramm Bremerhaven DWD 00701 Jahre 1986-2016.svg 800 × 600; 35 KB
-
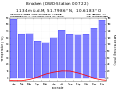
 Klimadiagramm Bremervörde (A) DWD 00703 Jahre 1955-1985.svg 800 × 600; 35 KB
-
 Klimadiagramm Brilon DWD 00717 Jahre 1946-1946.svg 800 × 600; 30 KB
-
 Klimadiagramm Brocken DWD 00722 Jahre 1987-2016.svg 800 × 600; 35 KB
-

-
 Klimadiagramm Brücken DWD 00736 Jahre 1964-1994.svg 800 × 600; 30 KB
-

-
 Klimadiagramm Burgwald-Bottendorf DWD 00817 Jahre 1975-2005.svg 800 × 600; 35 KB
-
 Klimadiagramm Bückeburg DWD 00769 Jahre 1979-2009.svg 800 × 600; 34 KB
-
 Klimadiagramm Bühlertal DWD 00772 Jahre 1956-1986.svg 800 × 600; 32 KB
-
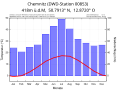 Klimadiagramm Chemnitz DWD 00853 Jahre 1987-2016.svg 800 × 600; 30 KB
-
 Klimadiagramm Clausthal-Zellerfeld DWD 00863 Jahre 1981-2011.svg 800 × 600; 32 KB
-
 Klimadiagramm Cottbus DWD 00880 Jahre 1984-2014.svg 800 × 600; 35 KB
-

-
 Klimadiagramm Cuxhaven DWD 00891 Jahre 1987-2016.svg 800 × 600; 35 KB
-

-
-
 Klimadiagramm Deuselbach DWD 00953 Jahre 1976-2006.svg 800 × 600; 35 KB
-
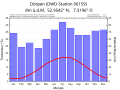
 Klimadiagramm Diepholz DWD 00963 Jahre 1964-1994.svg 800 × 600; 34 KB
-
 Klimadiagramm Dillenburg DWD 00979 Jahre 1953-1983.svg 800 × 600; 35 KB
-
 Klimadiagramm Dillingen Donau DWD 00982 Jahre 1976-2006.svg 800 × 600; 30 KB
-
 Klimadiagramm Dippoldiswalde-Reinberg DWD 00991 Jahre 1961-1991.svg 800 × 600; 30 KB
-
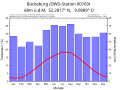
 Klimadiagramm Doberlug-Kirchhain DWD 01001 Jahre 1962-1992.svg 800 × 600; 34 KB
-
 Klimadiagramm Donaueschingen DWD 01018 Jahre 1966-1996.svg 800 × 600; 28 KB
-
 Klimadiagramm Dortmund DWD 01032 Jahre 1917-1946.svg 800 × 600; 35 KB
-
 Klimadiagramm Dresden (Mitte) DWD 01047 Jahre 1885-1915.svg 800 × 600; 30 KB
-
 Klimadiagramm Dresden-Hosterwitz DWD 01050 Jahre 1972-2002.svg 800 × 600; 35 KB
-
 Klimadiagramm Dresden-Klotzsche DWD 01048 Jahre 1987-2016.svg 800 × 600; 28 KB
-
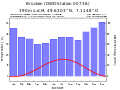
 Klimadiagramm Duisburg-Laar DWD 01087 Jahre 1951-1981.svg 800 × 600; 35 KB
-
 Klimadiagramm Dörpen DWD 06159 Jahre 1978-2008.svg 800 × 600; 35 KB
-
 Klimadiagramm Düsseldorf DWD 01078 Jahre 1987-2016.svg 800 × 600; 34 KB
-
 Klimadiagramm Düsseldorf-Südfriedhof DWD 01079 Jahre 1966-1996.svg 800 × 600; 34 KB
-
 Klimadiagramm Eberbach (LUBW) DWD 01093 Jahre 1975-2005.svg 800 × 600; 31 KB
-
 Klimadiagramm Ebrach DWD 01107 Jahre 1984-2014.svg 800 × 600; 28 KB
-
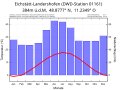 Klimadiagramm Eichstätt-Landershofen DWD 01161 Jahre 1975-2005.svg 800 × 600; 28 KB
-
 Klimadiagramm Einbeck DWD 01172 Jahre 1959-1989.svg 800 × 600; 34 KB
-
 Klimadiagramm Ellwangen-Rindelbach DWD 01197 Jahre 1987-2016.svg 800 × 600; 28 KB
-
 Klimadiagramm Elsdorf Erftkreis DWD 01201 Jahre 1971-2000.svg 800 × 600; 34 KB
-
 Klimadiagramm Elsfleth DWD 01204 Jahre 1935-1965.svg 800 × 600; 35 KB
-
 Klimadiagramm Emden-Nesserland DWD 01219 Jahre 1944-1974.svg 800 × 600; 35 KB
-
 Klimadiagramm Ems, Bad DWD 01229 Jahre 1967-1997.svg 800 × 600; 35 KB
-
 Klimadiagramm Engelskirchen DWD 01238 Jahre 1966-1996.svg 800 × 600; 32 KB
-
 Klimadiagramm Eppingen DWD 01254 Jahre 1972-2002.svg 800 × 600; 34 KB
-
 Klimadiagramm Erfde DWD 01266 Jahre 1982-2012.svg 800 × 600; 35 KB
-
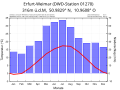 Klimadiagramm Erfurt-Weimar DWD 01270 Jahre 1987-2016.svg 800 × 600; 34 KB
-
 Klimadiagramm Eschenbach Oberpfalz DWD 01292 Jahre 1976-2006.svg 800 × 600; 35 KB
-
 Klimadiagramm Eschwege DWD 01297 Jahre 1960-1990.svg 800 × 600; 34 KB
-
 Klimadiagramm Eslohe DWD 01300 Jahre 1974-2004.svg 800 × 600; 31 KB
-
 Klimadiagramm Essen-Bredeney DWD 01303 Jahre 1971-2001.svg 800 × 600; 30 KB
-
 Klimadiagramm Eutin DWD 01329 Jahre 1974-2003.svg 800 × 600; 34 KB
-
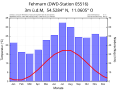 Klimadiagramm Fehmarn DWD 05516 Jahre 1966-1996.svg 800 × 600; 32 KB
-
 Klimadiagramm Feldberg Schwarzwald DWD 01346 Jahre 1985-2015.svg 800 × 600; 35 KB
-
 Klimadiagramm Fichtelberg DWD 01358 Jahre 1987-2016.svg 800 × 600; 32 KB
-

-
 Klimadiagramm Flensburg (Schäferhaus) DWD 01379 Jahre 1955-1985.svg 800 × 600; 30 KB
-
-
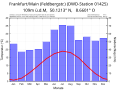
 Klimadiagramm Frankfurt Main DWD 01420 Jahre 1987-2016.svg 800 × 600; 32 KB
-
 Klimadiagramm Frankfurt Oder DWD 01426 Jahre 1955-1984.svg 800 × 600; 35 KB
-
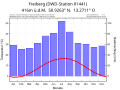 Klimadiagramm Freiberg DWD 01441 Jahre 1922-1952.svg 800 × 600; 30 KB
-
 Klimadiagramm Freiburg DWD 01443 Jahre 1975-2005.svg 800 × 600; 30 KB
-
 Klimadiagramm Freiburg Elbe DWD 01451 Jahre 1987-2016.svg 800 × 600; 30 KB
-

-
 Klimadiagramm Freudenstadt DWD 01468 Jahre 1974-2004.svg 800 × 600; 28 KB
-
 Klimadiagramm Friedrichshafen DWD 01490 Jahre 1950-1980.svg 800 × 600; 31 KB
-
 Klimadiagramm Friesoythe-Altenoythe DWD 01503 Jahre 1978-2008.svg 800 × 600; 35 KB
-
 Klimadiagramm Fulda-Horas DWD 01526 Jahre 1975-2005.svg 800 × 600; 35 KB
-
 Klimadiagramm Gardelegen DWD 01544 Jahre 1963-1993.svg 800 × 600; 32 KB
-
 Klimadiagramm Garmisch-Partenkirchen DWD 01550 Jahre 1975-2005.svg 800 × 600; 28 KB
-
 Klimadiagramm Geisenheim DWD 01580 Jahre 1984-2014.svg 800 × 600; 31 KB
-
 Klimadiagramm Geldern-Walbeck DWD 01590 Jahre 1987-2016.svg 800 × 600; 34 KB
-
 Klimadiagramm Genthin DWD 01605 Jahre 1965-1995.svg 800 × 600; 32 KB
-
 Klimadiagramm Gera-Leumnitz DWD 01612 Jahre 1987-2016.svg 800 × 600; 35 KB
-
 Klimadiagramm Gernsheim DWD 01619 Jahre 1976-2005.svg 800 × 600; 34 KB
-
 Klimadiagramm Gießen (Lahntal) DWD 01638 Jahre 1954-1984.svg 800 × 600; 34 KB
-
 Klimadiagramm Gießen Wettenberg DWD 01639 Jahre 1985-2015.svg 800 × 600; 32 KB
-
 Klimadiagramm Gilserberg-Moischeid DWD 01645 Jahre 1978-2008.svg 800 × 600; 35 KB
-
 Klimadiagramm Glückstadt DWD 01667 Jahre 1977-2006.svg 800 × 600; 35 KB
-
 Klimadiagramm Goldberg DWD 01694 Jahre 1963-1993.svg 800 × 600; 35 KB
-
 Klimadiagramm Gollhofen DWD 05149 Jahre 1965-1995.svg 800 × 600; 35 KB
-
 Klimadiagramm Grainet-Rehberg DWD 01735 Jahre 1971-2001.svg 800 × 600; 31 KB
-
 Klimadiagramm Grebenhain-Herchenhain DWD 01748 Jahre 1975-2005.svg 800 × 600; 32 KB
-
 Klimadiagramm Greifswald DWD 01757 Jahre 1987-2016.svg 800 × 600; 32 KB
-
 Klimadiagramm Grosser Falkenstein DWD 01833 Jahre 1952-1982.svg 800 × 600; 32 KB
-
 Klimadiagramm Großenkneten DWD 00044 Jahre 1982-2012.svg 800 × 600; 34 KB
-
 Klimadiagramm Gschwend, Kr. Ostalb DWD 01875 Jahre 1973-2002.svg 800 × 600; 30 KB
-
 Klimadiagramm Görlitz DWD 01684 Jahre 1987-2016.svg 800 × 600; 28 KB
-
 Klimadiagramm Göttingen DWD 01691 Jahre 1987-2016.svg 800 × 600; 34 KB
-
 Klimadiagramm Gößweinstein DWD 01689 Jahre 1974-2004.svg 800 × 600; 30 KB
-
 Klimadiagramm Halle (Stadt) DWD 01960 Jahre 1936-1966.svg 800 × 600; 32 KB
-
 Klimadiagramm Halle-Kröllwitz DWD 01957 Jahre 1968-1997.svg 800 × 600; 32 KB
-

-
 Klimadiagramm Hamburg-Bergedorf DWD 01972 Jahre 1932-1962.svg 800 × 600; 35 KB
-
 Klimadiagramm Hamburg-Fuhlsbüttel DWD 01975 Jahre 1987-2016.svg 800 × 600; 35 KB
-
 Klimadiagramm Hamburg-Kirchwerder DWD 01979 Jahre 1958-1988.svg 800 × 600; 34 KB
-
 Klimadiagramm Hamburg-Neuwiedenthal DWD 01981 Jahre 1978-2008.svg 800 × 600; 34 KB
-
 Klimadiagramm Hamburg-Sankt Pauli DWD 01987 Jahre 1967-1996.svg 800 × 600; 34 KB
-
 Klimadiagramm Hamburg-Wandsbek DWD 01990 Jahre 1955-1985.svg 800 × 600; 35 KB
-
 Klimadiagramm Hameln DWD 01993 Jahre 1977-2007.svg 800 × 600; 34 KB
-
 Klimadiagramm Hankensbüttel DWD 02005 Jahre 1965-1994.svg 800 × 600; 35 KB
-
 Klimadiagramm Hannover DWD 02014 Jahre 1987-2016.svg 800 × 600; 32 KB
-
 Klimadiagramm Harzgerode DWD 02044 Jahre 1910-1939.svg 800 × 600; 34 KB
-
 Klimadiagramm Hausstein DWD 02069 Jahre 1917-1946.svg 800 × 600; 34 KB
-
 Klimadiagramm Hechingen DWD 02074 Jahre 1982-2012.svg 800 × 600; 30 KB
-
 Klimadiagramm Heidelberg DWD 02080 Jahre 1956-1986.svg 800 × 600; 35 KB
-
 Klimadiagramm Heidenheim Brenz DWD 02088 Jahre 1974-2004.svg 800 × 600; 28 KB
-
 Klimadiagramm Heidenrod-Mappershain DWD 02092 Jahre 1961-1990.svg 800 × 600; 28 KB
-
 Klimadiagramm Heilbronn DWD 02095 Jahre 1973-2003.svg 800 × 600; 34 KB
-
 Klimadiagramm Heinersreuth-Vollhof DWD 00320 Jahre 1987-2016.svg 800 × 600; 35 KB
-
 Klimadiagramm Heinsberg-Schleiden DWD 02110 Jahre 1975-2005.svg 800 × 600; 32 KB
-
 Klimadiagramm Helgoland DWD 02115 Jahre 1985-2015.svg 800 × 600; 35 KB
-
 Klimadiagramm Helmstedt DWD 02120 Jahre 1977-2006.svg 800 × 600; 34 KB
-
 Klimadiagramm Helse, Kr. Dithmarschen DWD 02122 Jahre 1972-2002.svg 800 × 600; 30 KB
-
 Klimadiagramm Herford DWD 02147 Jahre 1978-2007.svg 800 × 600; 35 KB
-
 Klimadiagramm Herleshausen DWD 02151 Jahre 1961-1991.svg 800 × 600; 35 KB
-
 Klimadiagramm Hersdorf-Weißenseifen DWD 14311 Jahre 1976-2005.svg 800 × 600; 30 KB
-
 Klimadiagramm Hersfeld, Bad DWD 02171 Jahre 1974-2003.svg 800 × 600; 35 KB
-
 Klimadiagramm Herten DWD 02173 Jahre 1978-2007.svg 800 × 600; 30 KB
-
 Klimadiagramm Hildesheim DWD 02206 Jahre 1978-2008.svg 800 × 600; 34 KB
-
 Klimadiagramm Hilgenroth DWD 02211 Jahre 1977-2007.svg 800 × 600; 30 KB
-
 Klimadiagramm Hof (Stadt) DWD 02260 Jahre 1977-2006.svg 800 × 600; 35 KB
-
 Klimadiagramm Hof DWD 02261 Jahre 1987-2016.svg 800 × 600; 28 KB
-
 Klimadiagramm Hofgeismar-Beberbeck DWD 02264 Jahre 1971-2001.svg 800 × 600; 30 KB
-
 Klimadiagramm Hofheim DWD 02268 Jahre 1977-2006.svg 800 × 600; 35 KB
-
 Klimadiagramm Hohenpeißenberg DWD 02290 Jahre 1987-2016.svg 800 × 600; 32 KB
-
 Klimadiagramm Hohwacht DWD 02306 Jahre 1987-2016.svg 800 × 600; 34 KB
-
 Klimadiagramm Holzkirchen DWD 02319 Jahre 1987-2016.svg 800 × 600; 34 KB
-
 Klimadiagramm Homburg Saar DWD 02331 Jahre 1971-2001.svg 800 × 600; 30 KB
-
 Klimadiagramm Hornisgrinde DWD 02349 Jahre 1975-2005.svg 800 × 600; 29 KB
-
 Klimadiagramm Husum DWD 02374 Jahre 1916-1945.svg 800 × 600; 30 KB
-
 Klimadiagramm Höllenstein (Kraftwerk) DWD 02250 Jahre 1976-2006.svg 800 × 600; 31 KB
-
 Klimadiagramm Hüll DWD 02360 Jahre 1948-1978.svg 800 × 600; 30 KB
-

-
 Klimadiagramm Iserlohn-Westig DWD 02422 Jahre 1948-1978.svg 800 × 600; 30 KB
-
 Klimadiagramm Jena (Sternwarte) DWD 02444 Jahre 1986-2016.svg 800 × 600; 35 KB
-
 Klimadiagramm Jever DWD 02456 Jahre 1974-2004.svg 800 × 600; 35 KB
-
 Klimadiagramm Jork DWD 02464 Jahre 1960-1990.svg 800 × 600; 35 KB
-
 Klimadiagramm Jülich (Forsch.-Anlage) DWD 02474 Jahre 1976-2006.svg 800 × 600; 34 KB
-
 Klimadiagramm Kahl Main DWD 02480 Jahre 1958-1988.svg 800 × 600; 34 KB
-
 Klimadiagramm Kahler Asten DWD 02483 Jahre 1987-2016.svg 800 × 600; 32 KB
-
 Klimadiagramm Kaiserslautern DWD 02486 Jahre 1975-2005.svg 800 × 600; 32 KB
-
 Klimadiagramm Kaisheim-Neuhof DWD 02488 Jahre 1972-2002.svg 800 × 600; 30 KB
-
 Klimadiagramm Kall-Sistig DWD 02497 Jahre 1978-2007.svg 800 × 600; 35 KB
-
 Klimadiagramm Kaltennordheim DWD 02503 Jahre 1963-1993.svg 800 × 600; 28 KB
-
 Klimadiagramm Karlshuld DWD 02521 Jahre 1964-1994.svg 800 × 600; 30 KB
-
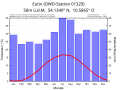
 Klimadiagramm Karlsruhe DWD 02522 Jahre 1978-2008.svg 800 × 600; 35 KB


_DWD_00231_Jahre_1944-1974.svg)


_DWD_00284_Jahre_1928-1958.svg)


_DWD_00361_Jahre_1917-1947.svg)


_DWD_00403_Jahre_1987-2016.svg)
_DWD_00402_Jahre_1915-1945.svg)


_DWD_00445_Jahre_1987-2016.svg)


_DWD_00661_Jahre_1894-1924.svg)


_DWD_00703_Jahre_1955-1985.svg)


_DWD_01047_Jahre_1885-1915.svg)


_DWD_01093_Jahre_1975-2005.svg)


_DWD_01379_Jahre_1955-1985.svg)
_DWD_01425_Jahre_1915-1945.svg)


_DWD_01638_Jahre_1954-1984.svg)


_DWD_01960_Jahre_1936-1966.svg)

_DWD_15526_Jahre_1906-1935.svg)


_DWD_02260_Jahre_1977-2006.svg)


_DWD_02250_Jahre_1976-2006.svg)

_DWD_02409_Jahre_1915-1945.svg)

_DWD_02444_Jahre_1986-2016.svg)


_DWD_02474_Jahre_1976-2006.svg)


