Category:Ultrastructure diagrams
Jump to navigation
Jump to search
Subcategories
This category has the following 3 subcategories, out of 3 total.
C
M
- Mitochondrial ultrastructure (64 F)
Media in category "Ultrastructure diagrams"
The following 200 files are in this category, out of 210 total.
(previous page) (next page)-
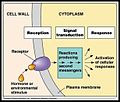
1Signal Transduction Pathways Model.jpg 616 × 523; 65 KB
-
1Signal Transduction Pathways Model.svg 579 × 480; 36 KB
-
Acción de receptores nucleares I.png 1,497 × 994; 469 KB
-
Acción de receptores nucleares II.png 1,502 × 1,129; 537 KB
-
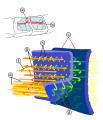
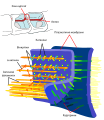
Actin Myosin Cross Bridges From Side.png 894 × 400; 11 KB
-
Actin Myosin Cross Bridges in Cross Section.png 894 × 400; 18 KB
-
ADCC.svg 744 × 420; 214 KB
-
Adherens Junctions structural proteins-ja.svg 504 × 579; 227 KB
-
Adherens Junctions structural proteins-LangNeutral.svg 531 × 619; 528 KB
-
Adherens Junctions structural proteins-ru.svg 504 × 579; 185 KB
-
Adherens Junctions structural proteins-uk.svg 504 × 579; 193 KB
-
Adhesion diagram.jpg 359 × 252; 84 KB
-
Animal cell diagram.png 360 × 360; 24 KB
-
Animal cell structure es.JPG 555 × 406; 39 KB
-
Animal cell structure tr.svg 600 × 420; 148 KB
-
Animal cell structure uk.svg 553 × 404; 174 KB
-
Aparell de Golgi (borderless version)-ca.svg 3,280 × 3,160; 33 KB
-
Aparell de Golgi (standalone version)-ca.svg 3,280 × 3,160; 33 KB
-
Assembly of filament.JPG 716 × 611; 71 KB
-
Atpsynthase.jpg 344 × 360; 35 KB
-
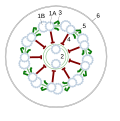
Axoneme cross-section.svg 656 × 656; 162 KB
-
Bilayer AFM schematic.png 2,391 × 1,503; 1.43 MB
-
Bilayer scheme.svg 290 × 92; 168 KB
-
Biogènesi.jpg 1,141 × 2,129; 592 KB
-
Biological cell german.png 2,110 × 1,216; 492 KB
-
Biological cell kk.png 530 × 241; 60 KB
-
Biological cell ku.svg 1,466 × 891; 185 KB
-
Biological cell ru.svg 2,067 × 941; 196 KB
-
Biological cell-2010-14-11.jpg 800 × 365; 86 KB
-
Cell junction simplified cs.svg 686 × 133; 62 KB
-
Cell junction simplified zh traditional.svg 686 × 128; 142 KB
-
Cell membrane detailed diagram blank.svg 716 × 296; 370 KB
-
Cell parts.png 492 × 259; 57 KB
-
Cell Structure , Cell Diagram.png 1,600 × 900; 218 KB
-
Cellorganeller pic swe 27-05-2007.png 603 × 481; 100 KB
-
Celltype zh.png 1,280 × 535; 176 KB
-
Celltypes gl.svg 450 × 188; 85 KB
-
Celltypes kn.svg 450 × 188; 102 KB
-
Celltypes rus.png 468 × 202; 51 KB
-
Celltypes telugu.svg 450 × 188; 238 KB
-
Celltypes.svg 512 × 214; 108 KB
-
Centriole ku.svg 800 × 650; 157 KB
-
Centrosoma (borderless version)-ca.svg 3,280 × 3,160; 186 KB
-
Centrosoma (standalone version)-ca.svg 3,280 × 3,160; 186 KB
-
Ch48f11.jpg 512 × 392; 39 KB
-
Characteristics of AD.jpg 2,400 × 1,680; 547 KB
-
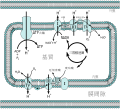
Chaîne de transport des électrons mitochondriale.svg 648 × 587; 321 KB
-
Chemiosmotic coupling mitochondrion.gif 400 × 259; 17 KB
-
Chemiosmotic proton transfer.gif 800 × 660; 56 KB
-
Chemiosmotic proton transfer.tr.png 727 × 600; 52 KB
-
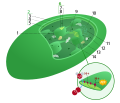
Chloroplast (borderless version)-ca.svg 3,280 × 3,160; 109 KB
-
Chloroplast (borderless version)-en.svg 3,040 × 2,600; 311 KB
-
Chloroplast (borderless version)-es.svg 3,040 × 2,600; 361 KB
-
Chloroplast (editors version).svg 3,280 × 3,160; 111 KB
-
Chloroplast (numbers version).svg 3,040 × 2,600; 126 KB
-
Chloroplast (standalone version)-ca.svg 3,280 × 3,160; 110 KB
-
Chloroplast (standalone version)-en.svg 3,280 × 3,160; 320 KB
-
Chloroplast (standalone version)-es.svg 3,280 × 3,160; 400 KB
-
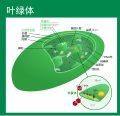
Chloroplast (standalone version)-zh-hans.svg 3,280 × 3,160; 171 KB
-
Chloroplast II-(sense marc)-ca.svg 1,000 × 700; 264 KB
-
Chloroplast II-ca.svg 1,100 × 1,050; 145 KB
-
Chloroplast mit Beschriftung.svg 512 × 404; 262 KB
-
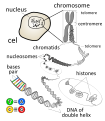
Chromosome en.svg 630 × 722; 431 KB
-
Chromosome ku.svg 630 × 722; 317 KB
-
Cicle de la Ran-GTP.PNG 2,000 × 1,350; 688 KB
-
Cilia Flow.jpg 404 × 290; 20 KB
-
Cillia-flagella.jpg 1,000 × 853; 203 KB
-
Cloroplasto.svg 648 × 400; 35 KB
-
Connexon and connexin structure.svg 687 × 448; 139 KB
-
Crowded cytosol.png 2,308 × 1,988; 9.72 MB
-
Célula Eucarionte.JPG 612 × 486; 48 KB
-
Desmosomi1.jpg 432 × 256; 53 KB
-
Diagram cell nucleus no text.svg 373 × 378; 114 KB
-
Diagram human cell nucleus (zh-cn).svg 462 × 378; 116 KB
-
Diagram human cell nucleus ar.svg 462 × 378; 313 KB
-
Diagram human cell nucleus bn.svg 462 × 378; 176 KB
-
Diagram human cell nucleus cs.svg 462 × 378; 425 KB
-
Diagram human cell nucleus cy.svg 462 × 378; 116 KB
-
Diagram human cell nucleus es.svg 462 × 378; 241 KB
-
Diagram human cell nucleus fr.svg 462 × 378; 268 KB
-
Diagram human cell nucleus hu.svg 462 × 378; 425 KB
-
Diagram human cell nucleus id.svg 462 × 378; 425 KB
-
Diagram human cell nucleus ja.svg 462 × 378; 189 KB
-
Diagram human cell nucleus ku.svg 462 × 378; 125 KB
-
Diagram human cell nucleus no text.png 310 × 296; 41 KB
-
Diagram human cell nucleus numbered version.svg 462 × 378; 88 KB
-
Diagram human cell nucleus oc.svg 462 × 378; 117 KB
-
Diagram human cell nucleus pl.svg 462 × 378; 281 KB
-
Diagram human cell nucleus pt.svg 462 × 378; 121 KB
-
Diagram human cell nucleus ru.svg 462 × 378; 112 KB
-
Diagram human cell nucleus serbian nuclear envelope.PNG 462 × 378; 46 KB
-
Diagram human cell nucleus serbian nuclear pore.PNG 462 × 378; 46 KB
-
Diagram human cell nucleus serbian nucleolus.PNG 462 × 378; 46 KB
-
Diagram human cell nucleus serbian nucleoplasm.PNG 462 × 378; 46 KB
-
Diagram human cell nucleus sk.jpg 462 × 378; 76 KB
-
Diagram human cell nucleus sk.svg 462 × 378; 439 KB
-
Diagram human cell nucleus sl.svg 462 × 378; 115 KB
-
Diagram human cell nucleus tr.svg 462 × 378; 443 KB
-
Diagram human cell nucleus uk.svg 462 × 378; 117 KB
-
Diagram human cell nucleus vi.svg 462 × 378; 212 KB
-
Diagram human cell nucleus-fa.svg 462 × 378; 165 KB
-
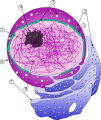
Diagram human cell nucleus.svg 462 × 378; 90 KB
-
Diagram of an animal cell in three dimensions.png 570 × 488; 34 KB
-
Electron transport chain (zh-cn).svg 648 × 587; 326 KB
-
Electron transport chain (zh-tw).svg 648 × 587; 317 KB
-
Electron transport chain vi.svg 822 × 435; 427 KB
-
Electron transport chain-es.svg 877 × 464; 275 KB
-
Electron transport chain.svg 822 × 435; 378 KB
-
Elisa wykrywanie przeciwciał.svg 600 × 600; 23 KB
-
Endocytosis types (id).jpg 672 × 336; 152 KB
-
Endocytosis types sv.svg 672 × 336; 43 KB
-
Endocytosis types-fr.svg 672 × 336; 51 KB
-
Endocytosis types-it.svg 672 × 336; 35 KB
-
Endocytosis types.svg 672 × 336; 96 KB
-
Endocytoza typy.svg 672 × 336; 43 KB
-
Endomembrane system diagram cs.svg 638 × 530; 326 KB
-
Endomembrane system diagram de.svg 612 × 486; 96 KB
-
Endomembrane system diagram en (edit) vi.svg 653 × 518; 176 KB
-
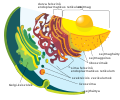
Endomembrane system diagram en.svg 612 × 486; 109 KB
-
Endomembrane system diagram es.svg 662 × 506; 95 KB
-
Endomembrane system diagram fr.svg 612 × 486; 244 KB
-
Endomembrane system diagram hu.svg 638 × 530; 326 KB
-
Endomembrane system diagram id.svg 640 × 500; 188 KB
-
Endomembrane system diagram it.svg 612 × 486; 79 KB
-
Endomembrane system diagram ka.svg 612 × 486; 89 KB
-
Endomembrane system diagram ln.svg 640 × 500; 188 KB
-
Endomembrane system diagram nl.svg 765 × 600; 192 KB
-
Endomembrane system diagram notext.svg 560 × 460; 98 KB
-
Endomembrane system diagram pl.svg 612 × 486; 249 KB
-
Endomembrane system diagram pt.svg 612 × 486; 286 KB
-
Endomembrane system diagram ru.svg 612 × 486; 78 KB
-
Endomembrane system diagram tr.svg 612 × 486; 163 KB
-
Endomembrane system diagram uk.svg 614 × 498; 295 KB
-
Endomembrane system diagram zh-tw.svg 612 × 486; 80 KB
-
Endomembrane system diagram zh.svg 612 × 486; 87 KB
-
Endoxidation.svg 645 × 777; 463 KB
-
Esquema de nucli cel·lular.PNG 552 × 346; 45 KB
-
Esquema epitelio intestinal.png 856 × 604; 208 KB
-
ETC electron transport chain.svg 822 × 435; 275 KB
-
Eukarya Flagella.svg 226 × 247; 58 KB
-
Eukaryote DNA-ar.png 2,000 × 1,235; 558 KB
-
Eukaryotic Cell (animal).jpg 1,317 × 856; 103 KB
-
Eukaryotic cilium diagram ar.png 505 × 431; 104 KB
-
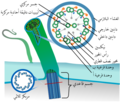
Eukaryotic cilium diagram en.svg 505 × 431; 138 KB
-
Eukaryotic cilium diagram it.svg 505 × 431; 270 KB
-
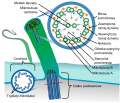
Eukaryotic cilium diagram pl.svg 505 × 431; 320 KB
-
Exocytosis types.svg 399 × 349; 90 KB
-
Exocytosis-machinery-es.png 700 × 475; 108 KB
-
Exocytosis-machinery.jpg 700 × 475; 147 KB
-
Exocytóza.png 201 × 84; 13 KB
-
Fagocytoza.svg 510 × 600; 17 KB
-
Fibra muscular.jpg 475 × 337; 22 KB
-
Formation des chromosomes.png 781 × 389; 27 KB
-
Fosforilación oxidativa.svg 1,002 × 621; 617 KB
-
Gap cell junction-en.svg 582 × 409; 49 KB
-
Golgijev stanica.png 200 × 200; 39 KB
-
Jenis sel.svg 450 × 188; 84 KB
-
Localisation et Fonction.JPG 360 × 270; 27 KB
-
Macro-micro-autophagy-transparent.png 598 × 442; 92 KB
-
Macro-micro-autophagy.gif 598 × 442; 13 KB
-
Methods of ph homeostasis and energy generation in acidophiles.png 1,019 × 956; 315 KB
-
Mitochondrial dna organization cartoon.jpg 948 × 1,780; 190 KB
-
Mitochondrie.svg 1,052 × 744; 31 KB
-
Mitochondrion structure no text.svg 600 × 490; 120 KB
-
Mitochondrium mit Beschriftung.svg 512 × 404; 696 KB
-
MR-mechanismus-epithel.png 875 × 875; 61 KB
-
Muscle protein interactions.png 894 × 400; 61 KB
-
Na-K pump cycle.jpg 800 × 457; 108 KB
-
Na-K pump cycle.png 800 × 457; 156 KB
-
NaK-ATPase.png 640 × 510; 6 KB
-
Nerve.svg 765 × 483; 551 KB
-
NuclearPore crop hu.svg 726 × 604; 2.34 MB
-
NuclearPore crop.png 721 × 600; 177 KB
-
Nucleosome assembly Dutch text.png 800 × 477; 145 KB
-
Nucleus ER golgi.jpg 492 × 565; 62 KB
-
Nucleus ER golgi.svg 492 × 565; 168 KB
-
Nucleus ER.png 416 × 469; 31 KB
-
Nucleus ER.svg 422 × 500; 96 KB
-
Nucléolo.png 703 × 578; 141 KB
-
Nukleosom4.png 587 × 270; 4 KB
-
Opal molecular structure Via Scanning EM (idealized).jpg 2,293 × 1,529; 2.08 MB
-
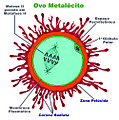
Ovo Metalécito.jpg 1,000 × 1,012; 1.67 MB
-
P Cell.svg 640 × 640; 162 KB
-
Pared celular.png 714 × 415; 84 KB
-
Passief-actief-transport-in-cel.svg 600 × 490; 67 KB
-
Pflanzenzelle-Tierzelle.svg 512 × 691; 2.79 MB
-
Pinocitosi.svg 300 × 330; 11 KB
-
Pinocitosis.svg 300 × 330; 85 KB
-
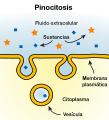
Pinocytosis.svg 300 × 330; 65 KB
-
Pinocytoza.svg 300 × 330; 13 KB
-
Pinozytose.svg 300 × 330; 17 KB
-
Plantcel.gif 175 × 287; 4 KB
-
Plasmodesma.Int.png 459 × 367; 10 KB
-
Prokaryotes.jpg 230 × 141; 7 KB
-
Prophase.jpg 160 × 160; 20 KB
-
RanGTPcycle.png 2,000 × 1,350; 913 KB
-
Scheme facilitated diffusion in cell membrane-es.svg 581 × 254; 97 KB
-
Scheme facilitated diffusion in cell membrane-fr.svg 581 × 254; 168 KB
